Data &
Technology
Research
Reports
Report Solutions
Reports Library
Actionable
Strategies
Free
Resources
Simple Backtest Calculator
Simple Seasonality Calculator
The Kelly Criterion Calculator
Sentiment Geo Map
Public Research Reports
Free Webinar
Pricing
Company
About
Meet Our Team
In the News
Testimonials
Client Success Stories
Contact
Log inLoginSign up
< BACK TO ALL REPORTS

New Features - Social Sentiment, Index Moving Average

Eric D. Brown
2016-12-19
null

Over the weekend, we added the following features to the site:

  • Added new Social Sentiment indicators. The new indicators are "Bearish Percent" and "Bullish Percent" for each of the active ETF's that we track.
  • Changed Social Sentiment indicators to allow different indexes and secondary indicators to be drawn.
  • Added the Russell 2000 Index to the Index Seasonality Chart.
  • Users now have the ability to add a moving average for the Index on charts. To add an Index Moving Average, select any moving average from the "Index Moving Average" drop-down menu on the chart page. These moving averages can be saved into your favorite configurations just like any other selection.

As always, you can find out about new additions / changes by visiting the "What's New" page.

Social Sentiment Changes

Social Sentiment is sentiment derived from performing automated natural language processing on messages collected from Twitter. Messages that mention a symbol (SPY for example) are collected and analyzed and given a rating of 'bullish', 'bearish' or 'neutral' (some messages are also categorized as 'spam'). From these messages, the percentage of bullish messages and bearish messages are then calculated (based on the total number of messages).

For each of the active ETF's on social media that we track, Social Percent Bearish and Social Percent Bullish are provided on the Social Sentiment listing page. A sample of the SPY Social Percent Bullish is below.

[caption id="attachment_1071" align="aligncenter" width="650"]SPY Social Percent Bullish 
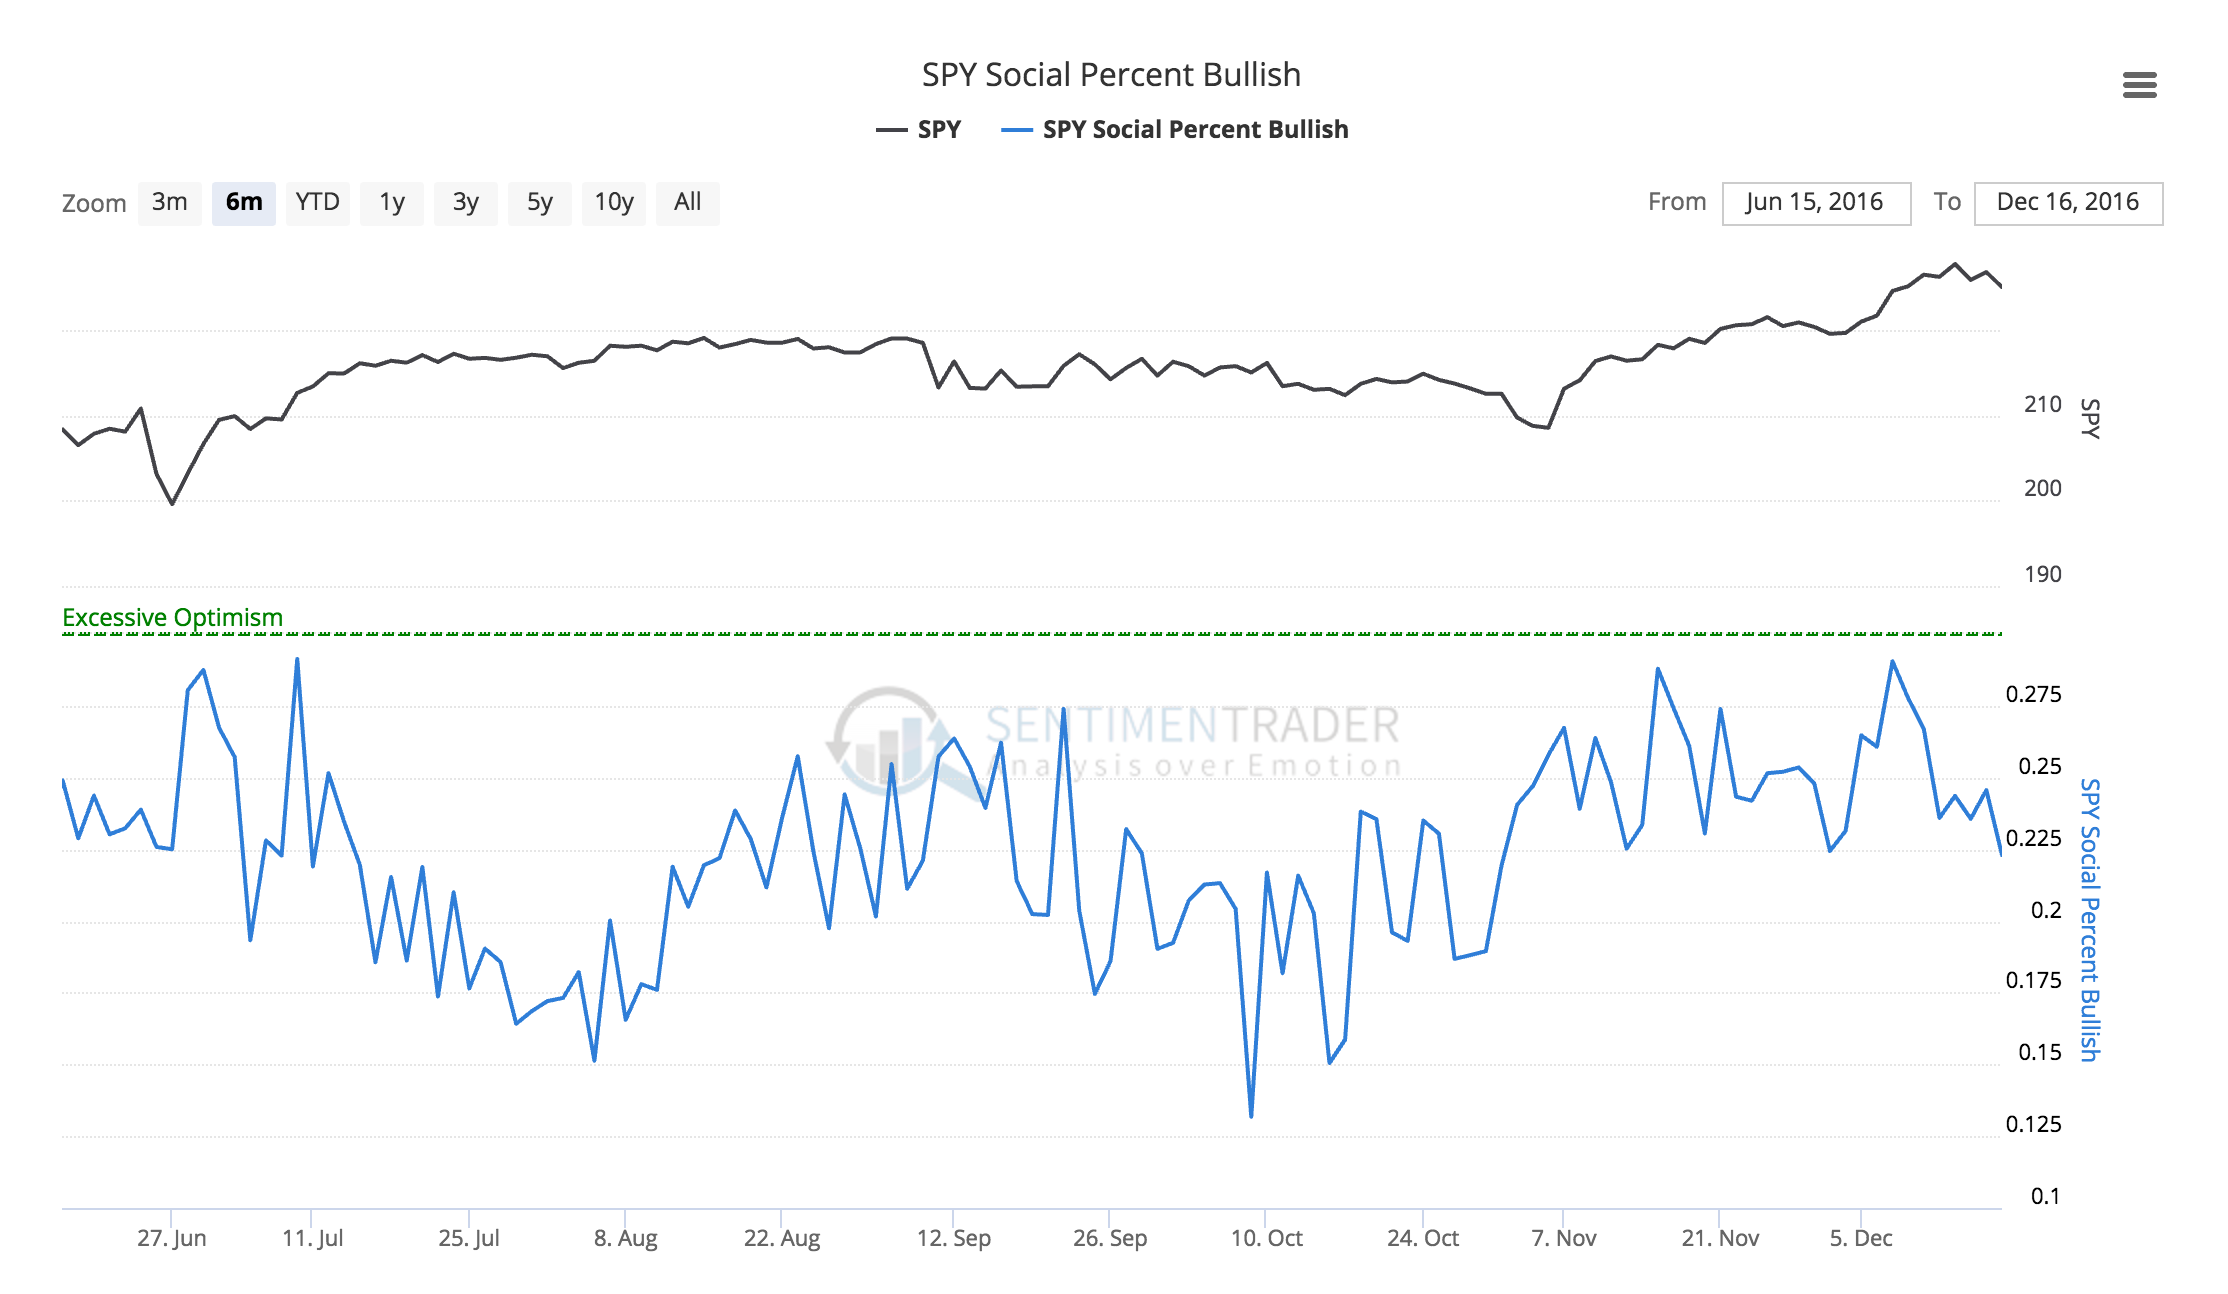
Figure 1: SPY Social Percent Bullish[/caption]

Social Sentiment Listing & Chart Changes

We made it easier to 'filter' the social sentiment listing by setting up the appropriate filters and categories. Like all other listing tables you can now filter the table by "Index", "Commodity", "Bond", "Country" and "Sector".

Additionally, we added the ability to view secondary indicators and different indexes to Social Sentiment indicators.

Russell 2000 added to Index Seasonality

Due to an oversight on our part, the Russell 2000 was not included in the Index Seasonality Chart. It has been added now. Along with SPX, DJIA and COMP, you can select "RUT" in the index dropdown to view the monthly seasonality by day of month.

Index Moving Averages

[caption id="attachment_1069" align="aligncenter" width="650"]Moving Averages on Indexes 
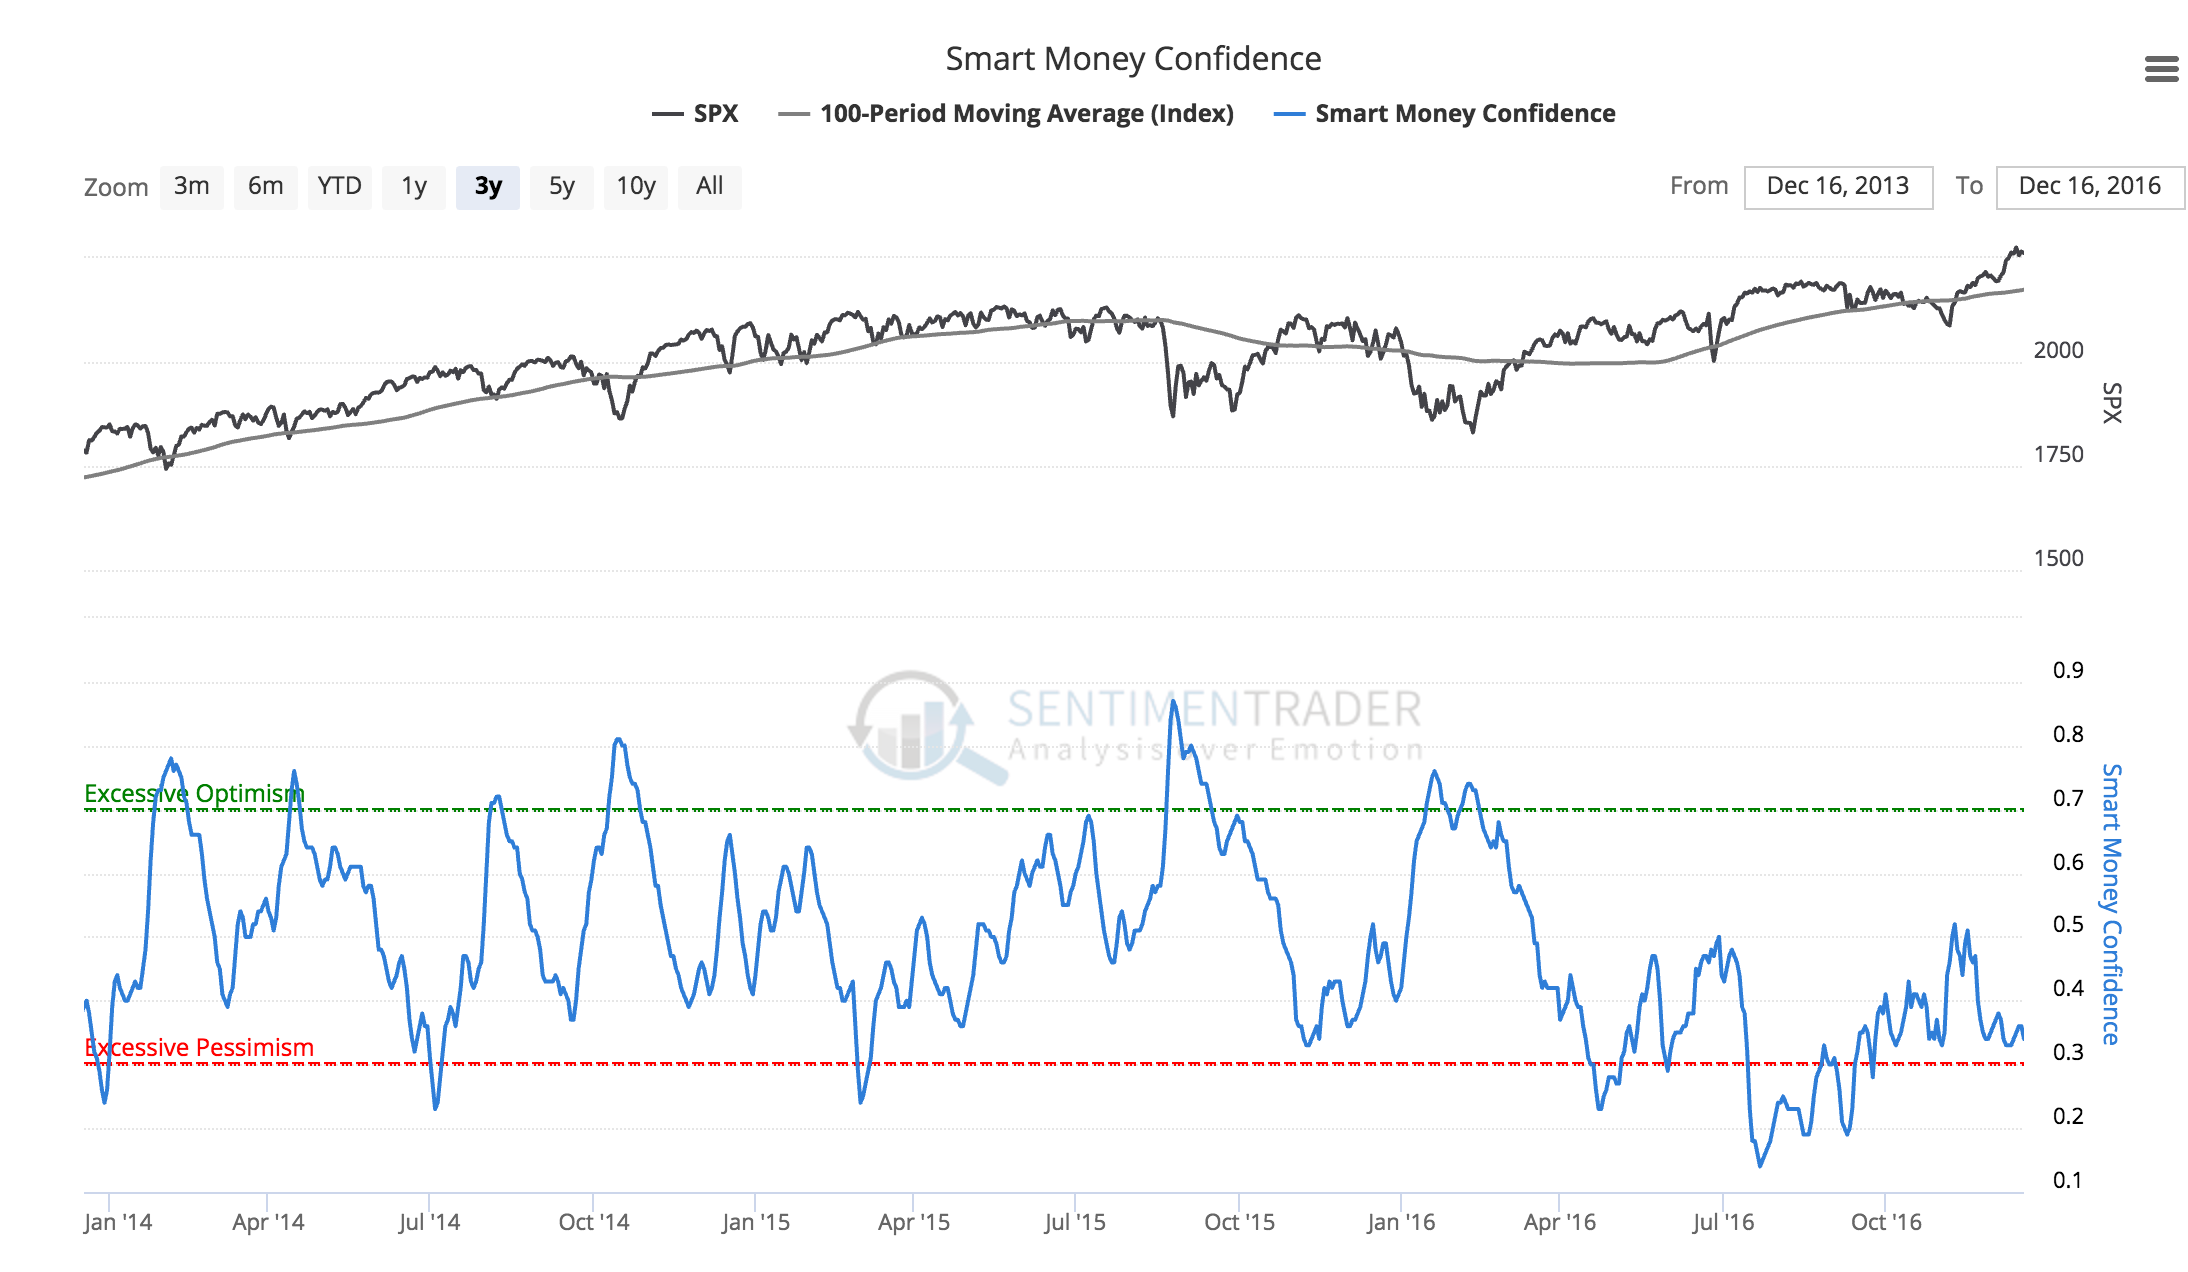
Figure 2: Moving Averages on Indexes[/caption]

One of the requested features for the site has been the ability to add a moving average to the Index panel of charts. This has now been added as a feature to our charts.

To add a moving average to an Index, use the 'Index Moving Average' dropdown menu located next to the "Indicator Moving Average" menu below the charts.


Sorry, you don't have access to this report

Upgrade your subscription plan to get access
Go to Dasboard
DATA &
TECHnologies
IndicatorEdge
‍
BackTestEdge
‍
Other Tools
‍
DataEdge API
RESEARCH
reports
Research Solution
‍
Reports Library
‍
actionable
Strategies
Trading Strategies
‍
Smart Stock Scanner
‍
FREE
RESOUrCES
Simple Backtest
Calculator
Simple Seasonality
Calculator
The Kelly Criterion
Calculator
Sentiment Geo Map
‍
Public Research Reports
‍
Free Webinar
COMPANY
‍
About
‍
Meet our Team
‍
In the News
‍
Testimonials
‍
Client Success Stories
Pricing
Bundle pricing
‍
Announcements
‍
FAQ
© 2024 Sundial Capital Research Inc. All rights reserved.
Setsail Marketing
TermsPrivacyAffiliate Program
Risk Disclosure: Futures and forex trading contains substantial risk and is not for every investor. An investor could potentially lose all or more than the initial investment. Risk capital is money that can be lost without jeopardizing ones’ financial security or life style. Only risk capital should be used for trading and only those with sufficient risk capital should consider trading. Past performance is not necessarily indicative of future results.

Hypothetical Performance Disclosure: Hypothetical performance results have many inherent limitations, some of which are described below. No representation is being made that any account will or is likely to achieve profits or losses similar to those shown; in fact, there are frequently sharp differences between hypothetical performance results and the actual results subsequently achieved by any particular trading program. One of the limitations of hypothetical performance results is that they are generally prepared with the benefit of hindsight. In addition, hypothetical trading does not involve financial risk, and no hypothetical trading record can completely account for the impact of financial risk of actual trading. for example, the ability to withstand losses or to adhere to a particular trading program in spite of trading losses are material points which can also adversely affect actual trading results. There are numerous other factors related to the markets in general or to the implementation of any specific trading program which cannot be fully accounted for in the preparation of hypothetical performance results and all which can adversely affect trading results.

Testimonial Disclosure: Testimonials appearing on this website may not be representative of other clients or customers and is not a guarantee of future performance or success.