
New Feature: Market Outlook
Over the weekend, we rolled out a new feature on the user dashboard titled Market Outlook which replaces the Risk Level Summary section.
The Market Outlook uses our Correction Risk Levels to gauge what our indicators and studies are suggesting. The higher the risk, the more likely the market is to decline.
Currently, we provide these Risk Levels for the equity (short- and medium-term), bonds, crude oil, gold and agriculture markets. The Market Outlook is shown in Figure 1 as an example.
[caption id="attachment_682" align="aligncenter" width="600"]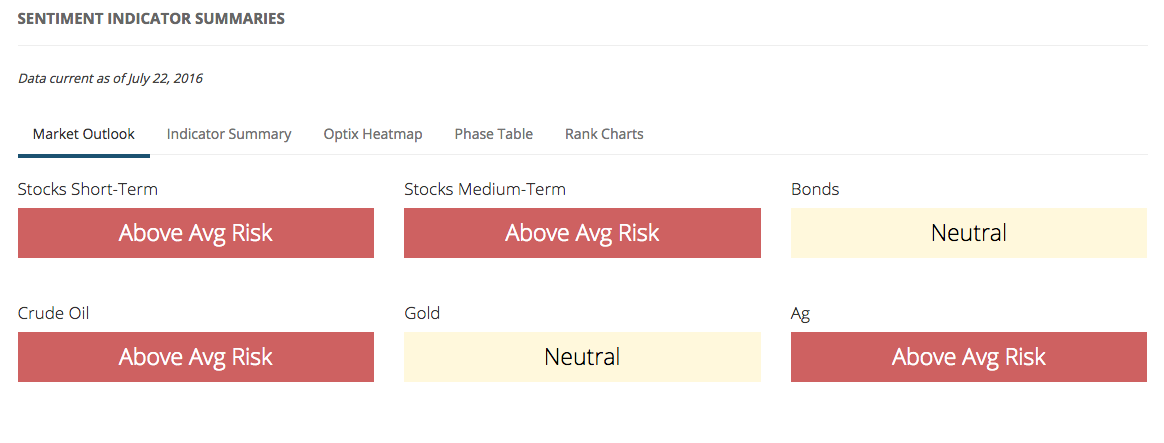 Figure 1: Market Outlook Risk Levels[/caption]
Each risk-level outlook is a clickable button that will take you to the risk-levels chart for that particular market/timeframe. On each chart, the underlying market and the risk-level indicator is shown along with four levels of risk (High Risk, Above Avg Risk, Below Avg Risk and Low Risk). The Stocks Short-Term Risk-Levels chart is shown in Figure 2 as an example.
[caption id="attachment_684" align="aligncenter" width="600"]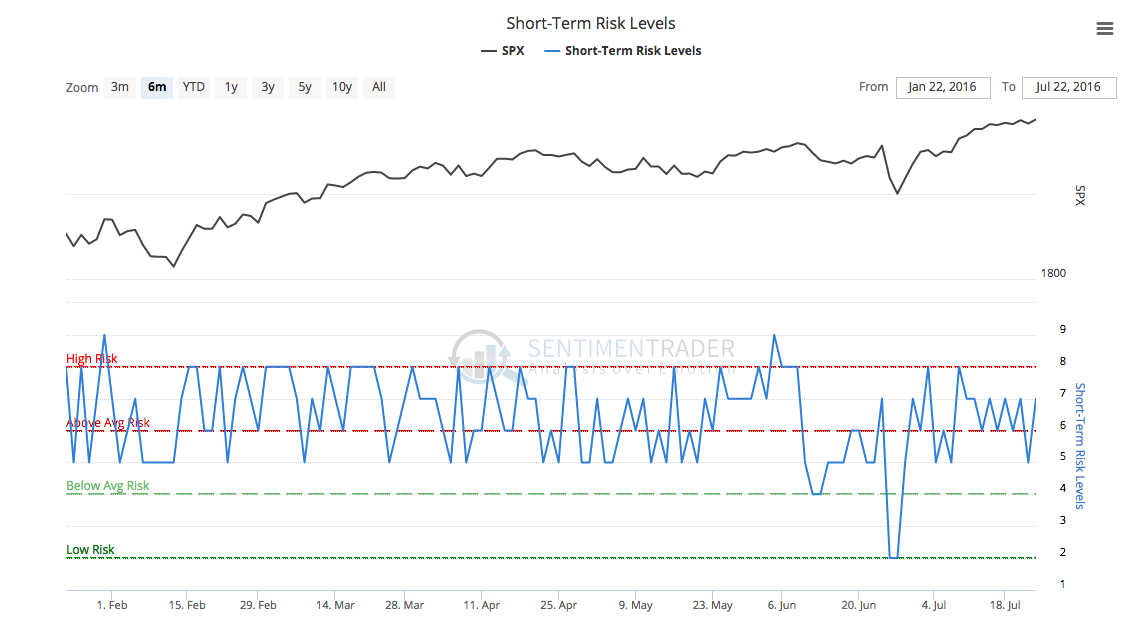 Figure 2: Stocks Short-Term Risk Level Chart[/caption]
The Market Outlook and each Risk-Level chart is available to all subscribers. If you aren’t a subscriber, click here to sign up for a free trial.