New Feature - Chart on Backtesting Engine
Over the weekend we pushed out a new version of our backtesting engine (see more info about the engine here and here) that includes a chart for the index and indicator that you are backtesting as well as results delivered to the same page (so you won't need to go back and forth between the backtest screen and results screen).
Now, when you go to the backtesting engine, you'll see the following screen:
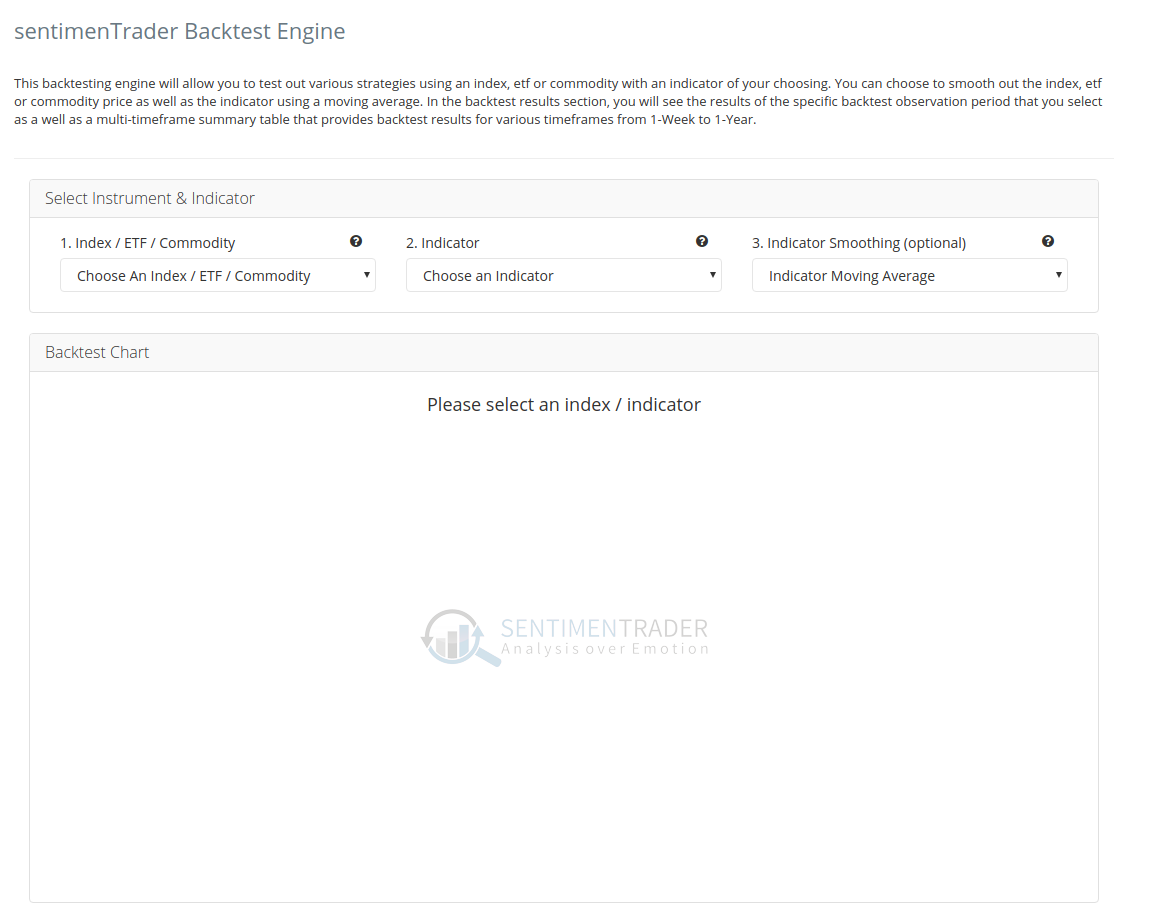
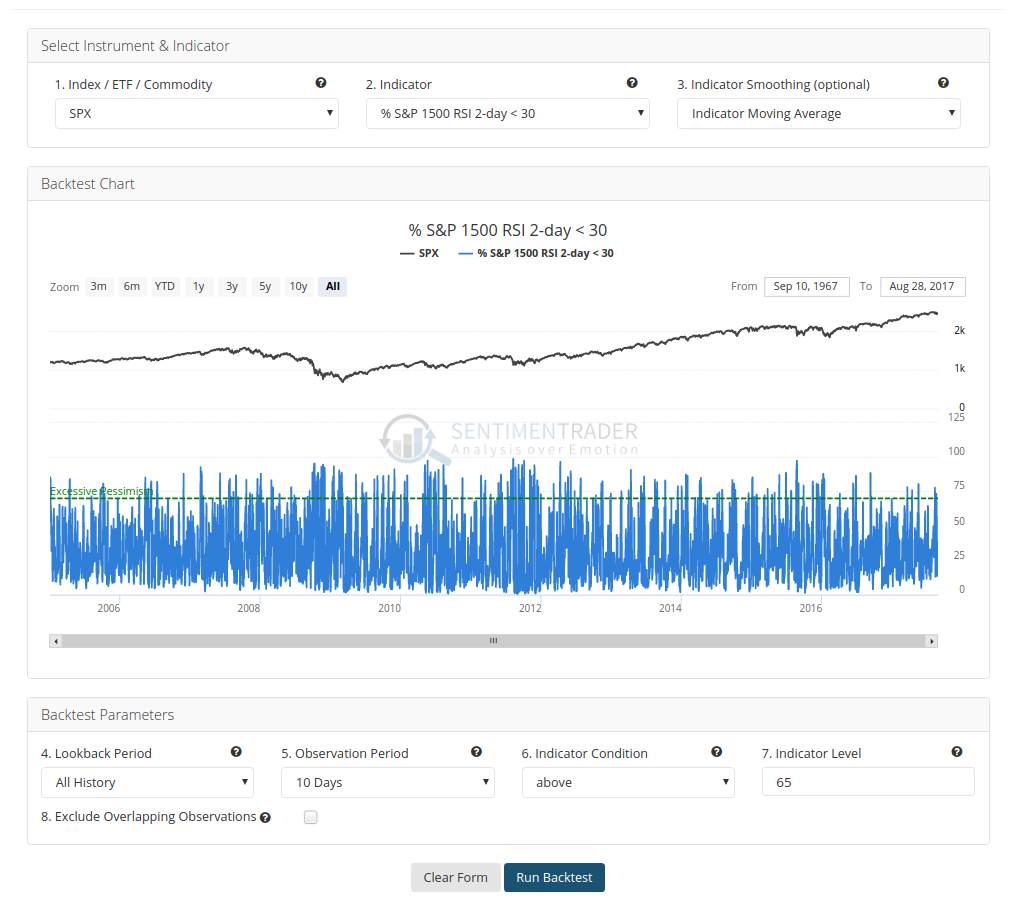
Once you select an index and an indicator, the chart will be drawn and will look similar to other charts on the site.
Once you've selected the index/indicator, the rest of the backtesting engine is the same. You can select a moving average (which will also draw on the chart) lookback period, observation period, indicator condition, indicator level and the option to exclude overlapping observations.
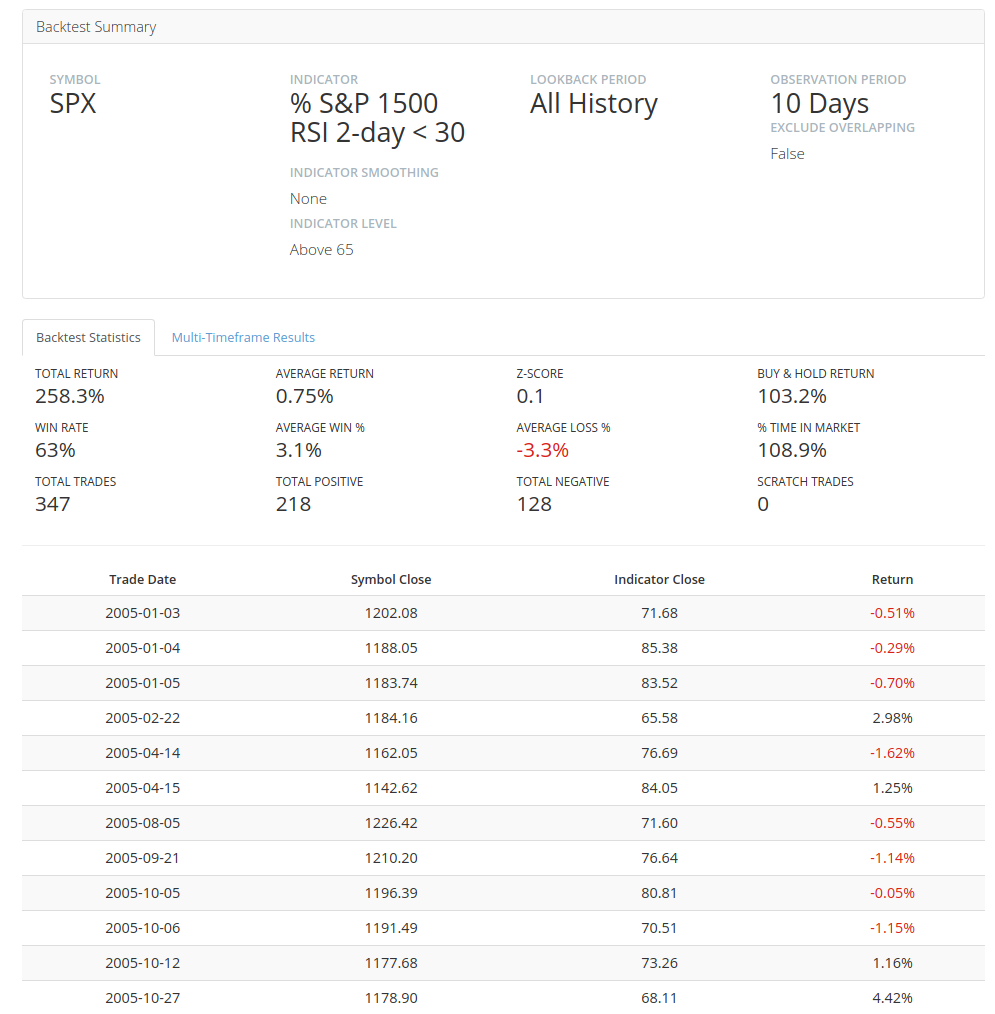
When ready to run the backtest, click the 'Run Backtest' button and the results will be rendered directly below the chart and backtest criteria section. Additionally, if you want to run another backtest, just scroll back to the top of the page and change the parameters and click 'Run backtest.'