Data &
Technology
Research
Reports
Report Solutions
Reports Library
Actionable
Strategies
Free
Resources
Simple Backtest Calculator
Simple Seasonality Calculator
The Kelly Criterion Calculator
Sentiment Geo Map
Public Research Reports
Free Webinar
Pricing
Company
About
Meet Our Team
In the News
Testimonials
Client Success Stories
Contact
Log inLoginSign up
< BACK TO ALL REPORTS

Negative bets on the energy rally are reversing

Jason Goepfert
2022-01-19
The put/call ratio on energy stocks is reversing from a high level. The Titanic Syndrome, a technical warning sign, has been firing on the NYSE and Nasdaq.

A reversal in negative energy bets

When investors are bullish on stocks, they buy call options to bet on rising prices. Conversely, when they are bearish on stocks, they purchase put options to bet on declining stocks. The put/call ratio can be used as a contrary indicator to identify an environment where sentiment has become too pessimistic on the future direction of stocks. When opinions become too bearish, stocks tend to rally.

The aggregated put/call ratio indicator measures the summed options data for constituents of the index/ETF. For Energy stocks, this put/call ratio is reversing from a relatively high level.

XLE energy put call ratio is reversing from an extreme

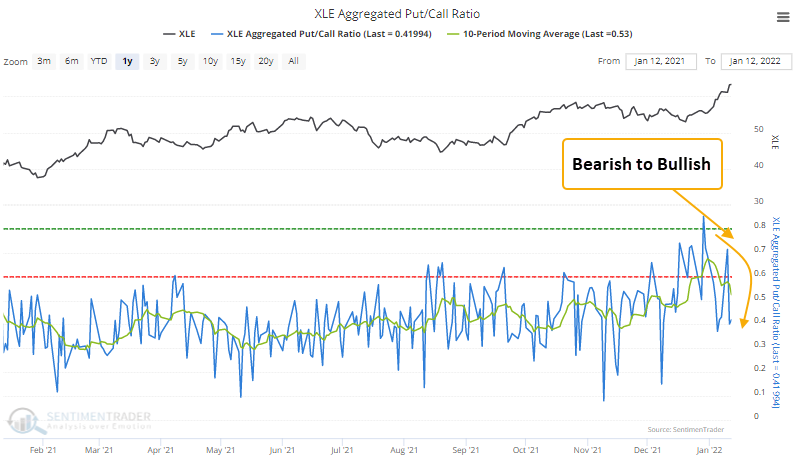
A similar reversal signal has triggered 10 other times over the past 8 years. After the others, XLE future returns, win rates, and z-scores were excellent across all time frames, especially the 2-month window when there were no losses. 

Stat box

Traders pulled more than $1.3 billion from the HYG high-yield bond fund on Tuesday. That's the 3rd-largest single-day outflow in the fund's history, next to two days in January and February 2020.


Technical warnings have piled up

Near the end of December, there was a surge in buying pressure in many stocks. That led to positive breadth thrusts in the S&P 500 and even among broader securities traded on the NYSE. Markets have not reacted well since, which is a worry.

From a longer-term point of view, there are other concerns. Over the past six months, there have been many days when indexes like the S&P 500 or Nasdaq Composite have reached a 52-week high. However, within mere days, more stocks and other securities were trading at 52-week lows than 52-week highs.

That type of behavior has triggered a cluster of Titanic Syndrome warnings for securities on the NYSE.

The Titanic Syndrome technical warning is firing

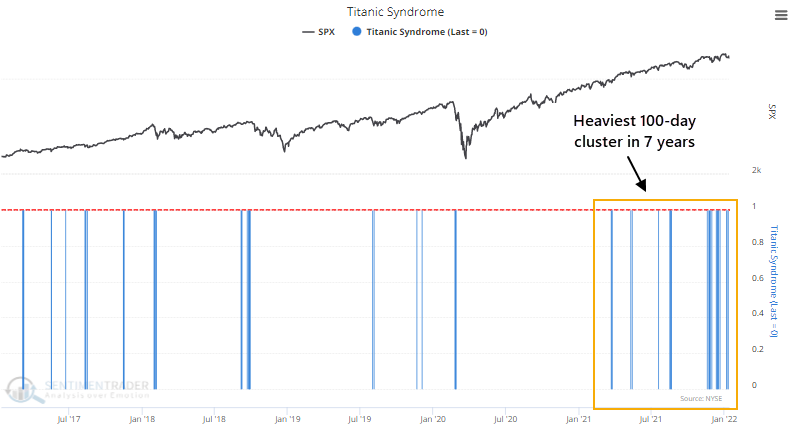
Those haven't just been firing on the NYSE. While fewer lately, there have also been a bunch of signals among securities traded on the Nasdaq.

When we combine the signals on both exchanges and tally them up over the past 6 months, there have been 34 signals. In other words, nearly 30% of all days since July have seen a Titanic Syndrome warning on either the NYSE or Nasdaq exchanges. This is the 3rd-highest reading in almost 40 years.

DATA &
TECHnologies
IndicatorEdge
‍
BackTestEdge
‍
Other Tools
‍
DataEdge API
RESEARCH
reports
Research Solution
‍
Reports Library
‍
actionable
Strategies
Trading Strategies
‍
Smart Stock Scanner
‍
FREE
RESOUrCES
Simple Backtest
Calculator
Simple Seasonality
Calculator
The Kelly Criterion
Calculator
Sentiment Geo Map
‍
Public Research Reports
‍
Free Webinar
COMPANY
‍
About
‍
Meet our Team
‍
In the News
‍
Testimonials
‍
Client Success Stories
Pricing
Bundle pricing
‍
Announcements
‍
FAQ
© 2024 Sundial Capital Research Inc. All rights reserved.
Setsail Marketing
TermsPrivacyAffiliate Program
Risk Disclosure: Futures and forex trading contains substantial risk and is not for every investor. An investor could potentially lose all or more than the initial investment. Risk capital is money that can be lost without jeopardizing ones’ financial security or life style. Only risk capital should be used for trading and only those with sufficient risk capital should consider trading. Past performance is not necessarily indicative of future results.

Hypothetical Performance Disclosure: Hypothetical performance results have many inherent limitations, some of which are described below. No representation is being made that any account will or is likely to achieve profits or losses similar to those shown; in fact, there are frequently sharp differences between hypothetical performance results and the actual results subsequently achieved by any particular trading program. One of the limitations of hypothetical performance results is that they are generally prepared with the benefit of hindsight. In addition, hypothetical trading does not involve financial risk, and no hypothetical trading record can completely account for the impact of financial risk of actual trading. for example, the ability to withstand losses or to adhere to a particular trading program in spite of trading losses are material points which can also adversely affect actual trading results. There are numerous other factors related to the markets in general or to the implementation of any specific trading program which cannot be fully accounted for in the preparation of hypothetical performance results and all which can adversely affect trading results.

Testimonial Disclosure: Testimonials appearing on this website may not be representative of other clients or customers and is not a guarantee of future performance or success.