Data &
Technology
Research
Reports
Report Solutions
Reports Library
Actionable
Strategies
Free
Resources
Simple Backtest Calculator
Simple Seasonality Calculator
The Kelly Criterion Calculator
Sentiment Geo Map
Public Research Reports
Free Webinar
Pricing
Company
About
Meet Our Team
In the News
Testimonials
Client Success Stories
Contact
Log inLoginSign up
< BACK TO ALL REPORTS

Nearly a third of small-caps are losing money

Jason Goepfert
2020-07-07
The forward price/earnings ratio for small-cap stocks is at a 25-year high. Part of the reason is uncertainty surrounding fundamentals, not helped by the fact that nearly a third of stocks in the Russell 2000 are showing operating losses over the past 12 months. That high of a percentage of money-losers has only been seen twice before in 20 years.

By some measures, stocks have never been so expensive, especially smaller ones.

The problems with most valuation measures are well-documented, and Marketwatch highlighted one of them that is particularly prominent with small-cap stocks. A lot of small companies lose money, and those are often not included when firms calculate metrics like price/earnings ratios.

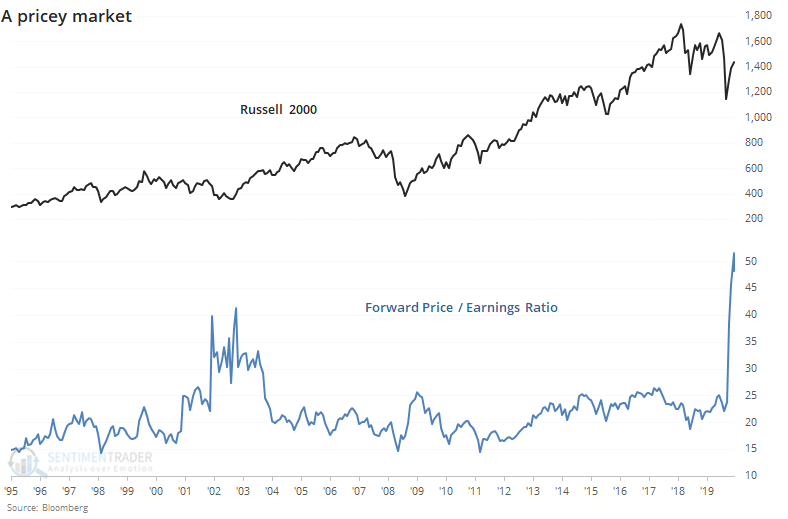
If we use forward earnings estimates from Bloomberg, then we can alleviate some of those issues. Even so, small stocks haven't been this pricey in 25 years.

Granted, estimated earnings bring their own set of issues, especially now with uncertainty so high. The last time the forward P/E ratio for Russell 2000 stocks spiked above 40 was the bottom of the 2002 bear market, so this is not necessarily a reason to think stocks are expensive, just that uncertainty about profits is high.

If we focus on the other issue, the fact that many of these companies are losing money, then it seems like a major negative. Below, we can see the percentage of firms in the Russell 2000 that have negative operating earnings over the trailing 12 months. It just moved above 30%, the most in over a decade.

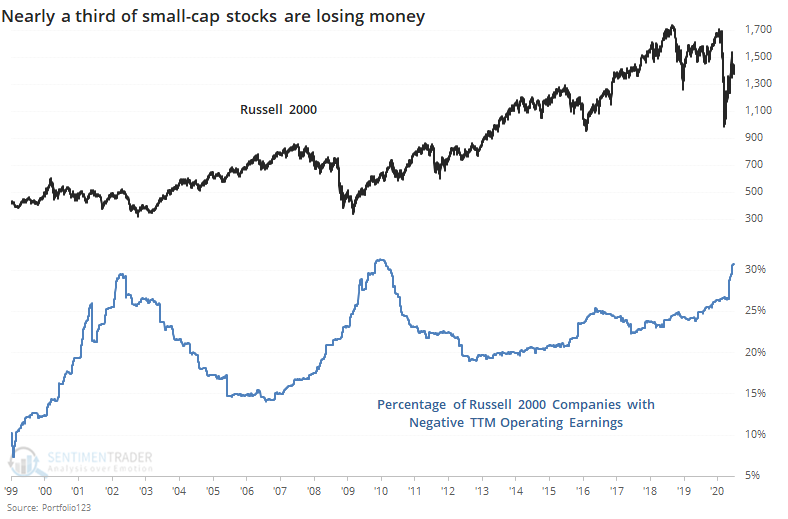
Only twice before in 20 years have such a high proportion of these small companies lost money - April 2002 and December 2009 through February 2010.

Investors are anticipatory creatures, so by the time so many companies experienced negative earnings, stocks had already suffered major losses. By the time it got to this point, investors were already anticipating the turn, and the Russell was close to bottoming (in 2002) or already had (in 2009).

It's common to see hyperbolic headlines about high valuations and a preponderance of money-losing companies. It's less common to see an objective look at what it might mean. There isn't much history here, but from what we can see from the rare precedents, these fundamental worries are overblown.

Sorry, you don't have access to this report

Upgrade your subscription plan to get access
Go to Dasboard
DATA &
TECHnologies
IndicatorEdge
‍
BackTestEdge
‍
Other Tools
‍
DataEdge API
RESEARCH
reports
Research Solution
‍
Reports Library
‍
actionable
Strategies
Trading Strategies
‍
Smart Stock Scanner
‍
FREE
RESOUrCES
Simple Backtest
Calculator
Simple Seasonality
Calculator
The Kelly Criterion
Calculator
Sentiment Geo Map
‍
Public Research Reports
‍
Free Webinar
COMPANY
‍
About
‍
Meet our Team
‍
In the News
‍
Testimonials
‍
Client Success Stories
Pricing
Bundle pricing
‍
Announcements
‍
FAQ
© 2024 Sundial Capital Research Inc. All rights reserved.
Setsail Marketing
TermsPrivacyAffiliate Program
Risk Disclosure: Futures and forex trading contains substantial risk and is not for every investor. An investor could potentially lose all or more than the initial investment. Risk capital is money that can be lost without jeopardizing ones’ financial security or life style. Only risk capital should be used for trading and only those with sufficient risk capital should consider trading. Past performance is not necessarily indicative of future results.

Hypothetical Performance Disclosure: Hypothetical performance results have many inherent limitations, some of which are described below. No representation is being made that any account will or is likely to achieve profits or losses similar to those shown; in fact, there are frequently sharp differences between hypothetical performance results and the actual results subsequently achieved by any particular trading program. One of the limitations of hypothetical performance results is that they are generally prepared with the benefit of hindsight. In addition, hypothetical trading does not involve financial risk, and no hypothetical trading record can completely account for the impact of financial risk of actual trading. for example, the ability to withstand losses or to adhere to a particular trading program in spite of trading losses are material points which can also adversely affect actual trading results. There are numerous other factors related to the markets in general or to the implementation of any specific trading program which cannot be fully accounted for in the preparation of hypothetical performance results and all which can adversely affect trading results.

Testimonial Disclosure: Testimonials appearing on this website may not be representative of other clients or customers and is not a guarantee of future performance or success.