
Near record uptrends as rally hits the 9-month mark

We'd seen a couple of weeks ago that almost all stocks, industries, sectors, and countries were in uptrends. After a brief pullback, indexes have stormed back to new highs, and more stocks have climbed above their long-term trends.
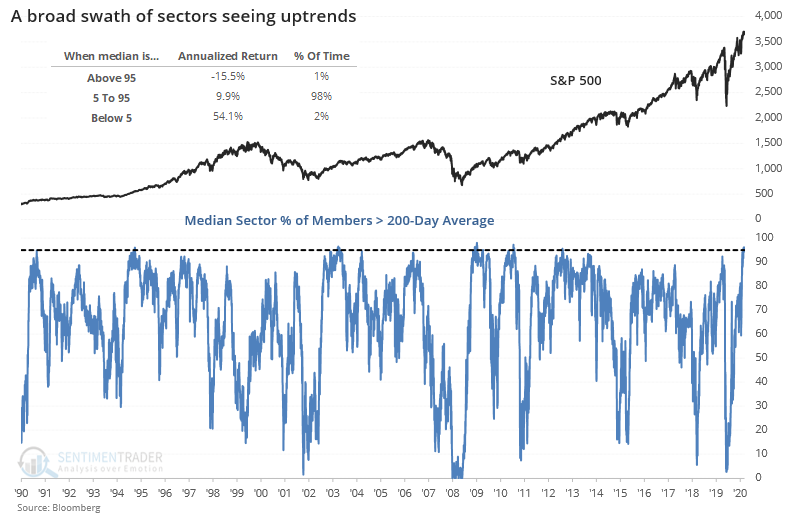
The breadth of the advance continues to be impressive. Out of the 10 major S&P 500 sectors, the median one has more than 95% of its member stocks in an uptrend. That's the most in almost a decade.
We can see from the chart that only about 1% of days over the past 30 years have seen participation this wide across sectors. The S&P's annualized return after those days wasn't too inspiring. That figure is derived by looking at very short-term returns and projecting it over the year.
Not only does the median sector have almost every one of its stocks in an uptrend, even the worst sector recently had more than 80% of its stocks above their 200-day moving averages.
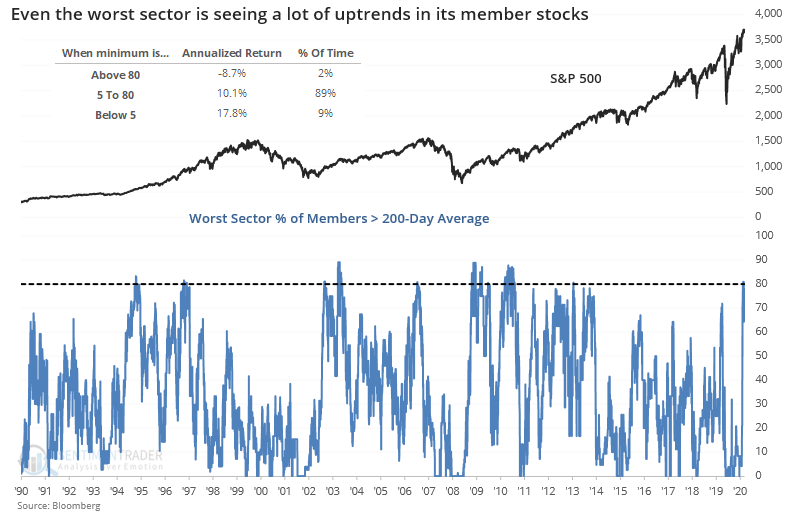
It's rare to see even the worst laggard among sectors see such widespread uptrends among its stocks, only occurring on about 2% of all days. And, again, the S&P's annualized return after those days was poor.
Over the past 30 years, there have been 23 days when the median sector had at least 95% of its members in uptrends, and even the worst sector had at least 75% participation.
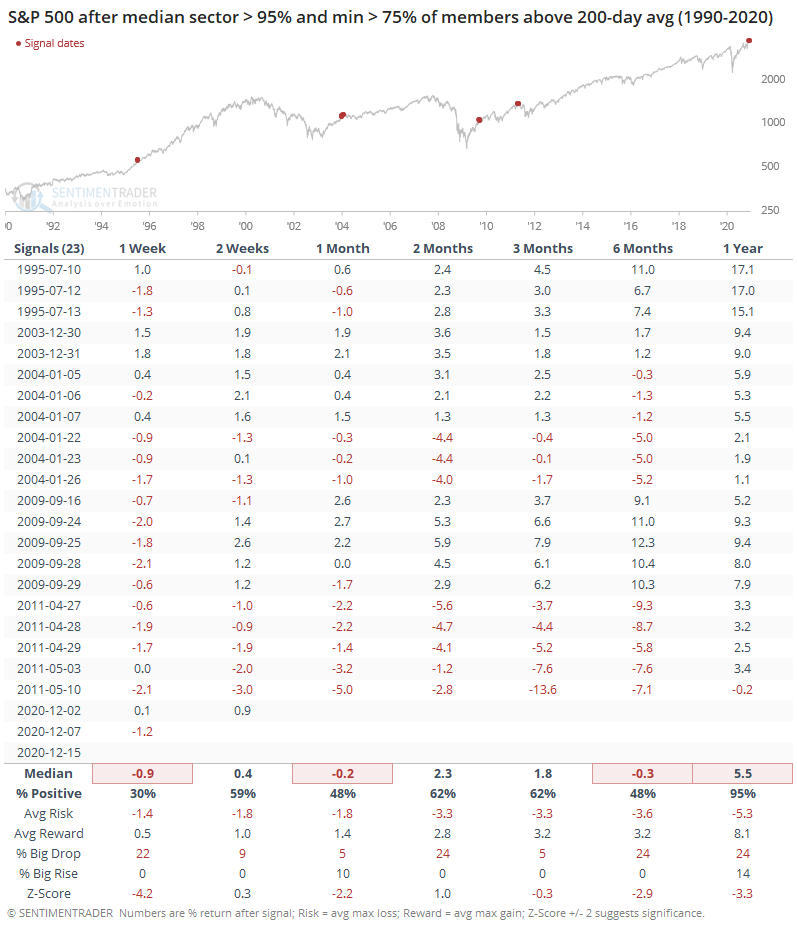
The S&P's short- to medium-term performance was quite weak. By a year later, there was only a single (tiny) loss, even though most of the gains were relatively small.
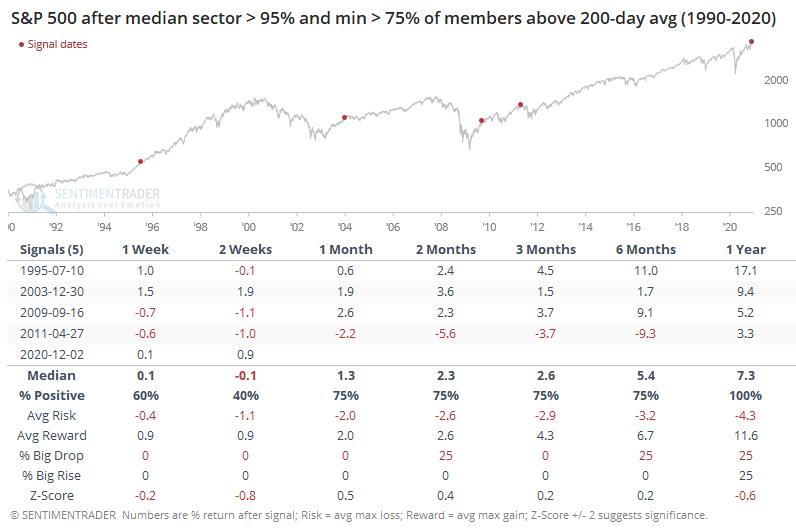
While the forward returns were not great, they were clustered among only a handful of distinct time periods. When we look at only the first signal in a cluster, then it didn't look so bad. Even so, only the 1995 signal saw stocks go gangbusters to the upside - if the others enjoyed some additional shorter-term gains, those were erased during a subsequent (albeit temporary) pullback.
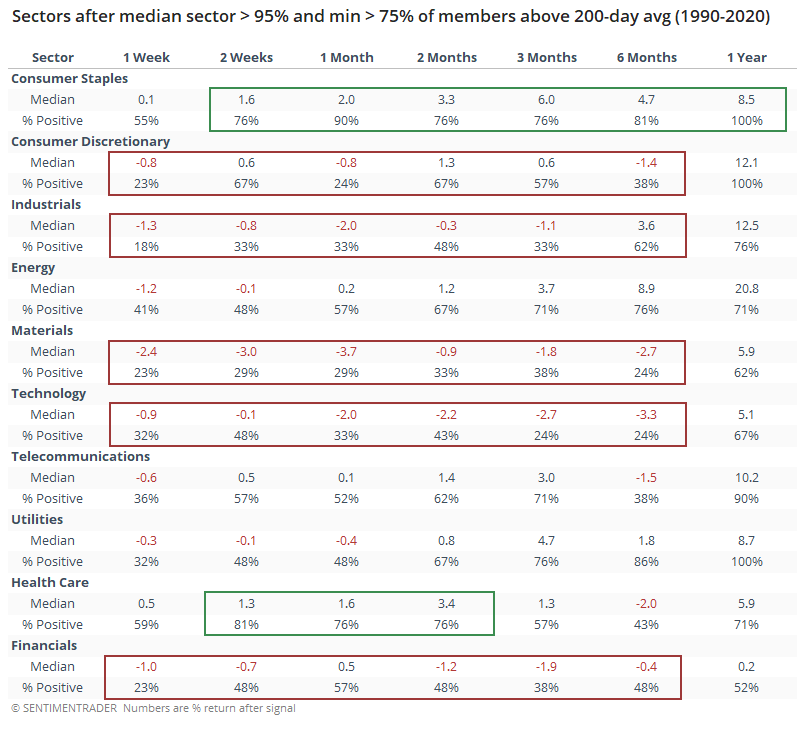
Among the sectors themselves, the table below shows how they reacted after these extremes. Staples and health care tended to fare the best, while industrials, discretionary, materials, technology, and financials often struggled.
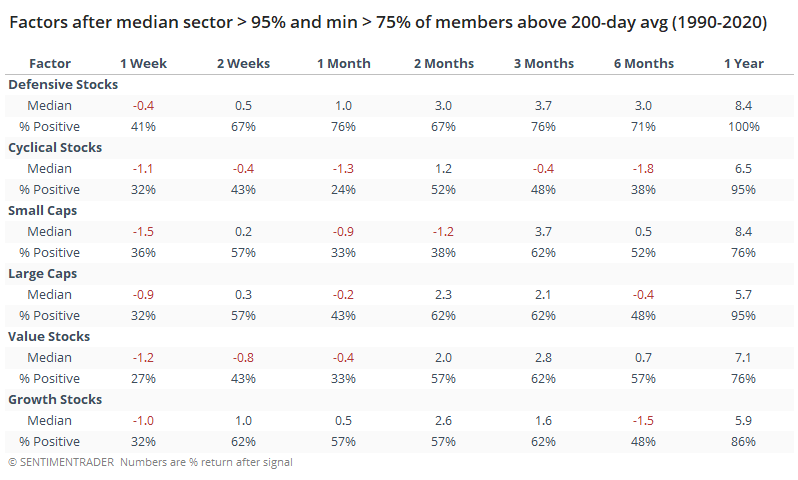
We can see that among factors, too. Over the following month, defensive stocks returned an average of +1.0% and were positive on 76% of the days, while cyclical stocks averaged -1.3% and were positive only 24% of the time.
It's hard to not be impressed by the breadth of this rally, but also its magnitude. As of Friday we're at the 9-month mark and this ranks among the best rallies off a low in market history.
Using the Dow Industrials back to 1896, let's look at every time it fell to at least a 3-year low then rallied for at least a year. The chart below shows the Dow's current price path along with that of the highest-correlated rallies.
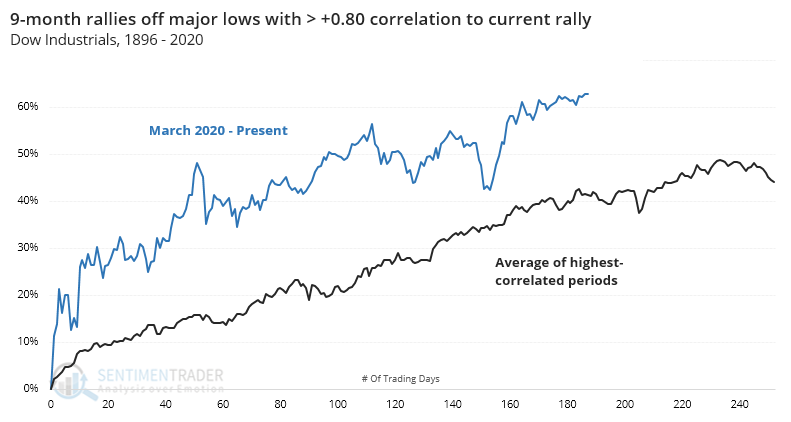
The current one has been about 20 percentage points greater than the average rally off a major bottom. The 10 most recent ones are shown below.
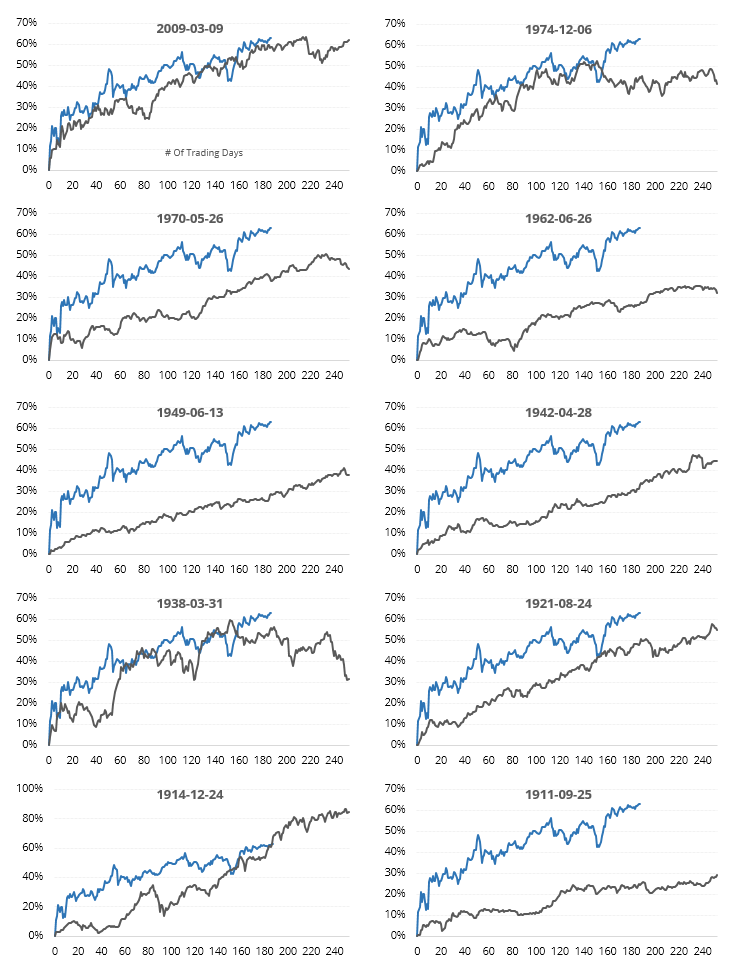
By the time the others reached the 9-month mark, there was some shorter-term weakness but it mostly didn't last.
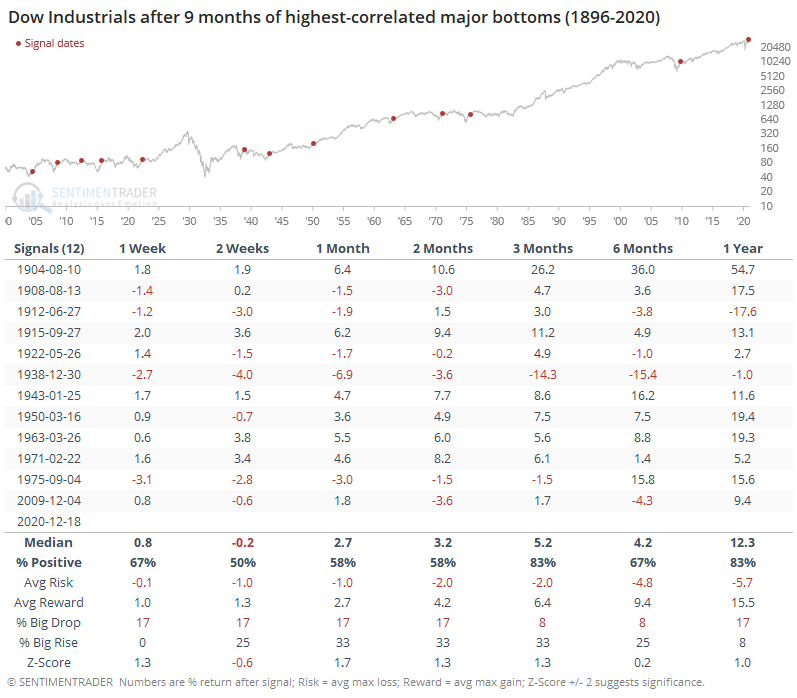
The next couple of weeks were choppy, but we wouldn't put much weight on the short-term. Over the next 3 months, the Dow continued its rally after 10 of the 12 instances, and only one of the exceptions showed a meaningful loss. The probability of a big gain was quite a bit higher than that of a big loss up to 6 months later.
Most of what we've seen in recent weeks, with the battle between extreme sentiment and extreme momentum, has shown weak or inconsistent returns for stocks over a short- to medium-term time frame. Most of the time when we see conditions like this, if there are further shorter-term gains, they're almost always erased during a subsequent pullback of 3%-8%. The calendar and momentum are providing decent support for bulls, as long as one realizes that sustained gains over a multi-week to multi-month time frame are rare.