
Near-Record Levels Of Optimism

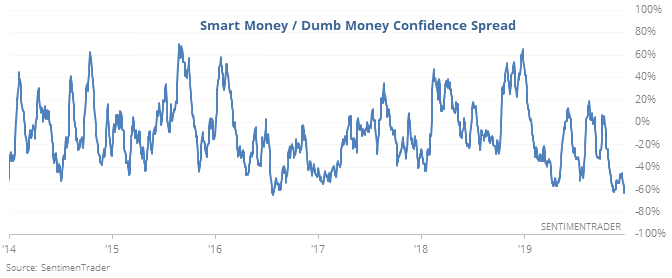
Dumb Money Confidence has spiked while Smart Money is retreating.
Near-record optimism
A year ago, the “dumb money” was the most bearish in 20 years. Now, a year later, they’re the 2nd-most optimistic, barely eclipsed by a few days in April 2010. Indicators focused on the “smart money” are near the opposite extreme, causing the spread to widen to one of the worst levels we’ve seen since 1998.
After these other bouts of bubbly buyers, the S&P had a strong tendency to relax over the next 1-3 months, which is the sweet spot for much of what we cover on the site. All but one of the dates showed a negative return over one of those time frames, and the exception (December 2010) peaked right about then and ended up erasing all of the gains. Up to three months later, average risk exceeded reward.
Breadth Breakout
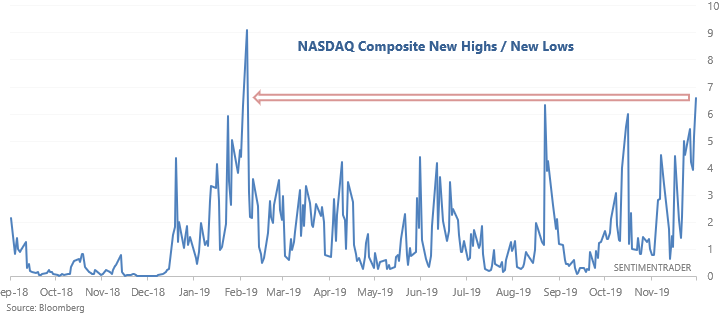
With the overall stock market surging, more and more members are making new 52 week highs vs. members making new 52 week lows. Earlier last week, the ratio of NYSE New Highs to New Lows spiked to highest level in more than 200 days. Now we're seeing something similar on the Nasdaq.
When it spiked like this in the past, the NASDAQ Composite's returns were still mostly bullish, but not as bullish as for the S&P.
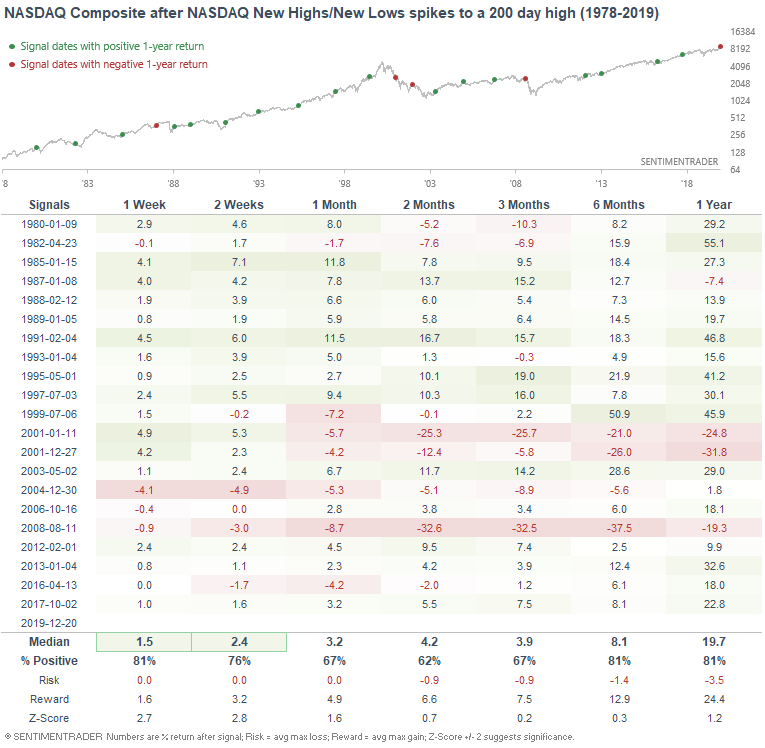
This worked better before the 2000s than after the 2000s. Over the past 20 years, the Nasdaq's returns were quite poor over the next month.
This is an abridged version of our recent reports and notes. For immediate access with no obligation, sign up for a 30-day free trial now.
We also looked at:
- Gamma exposure is at a record high
- The S&P's Relative Strength Index (RSI) is at a high level for the 1st time in a year
- It's also well above its 200-day average
- And most of its component stocks are above their short-, medium- and long-term averages
- Our CNN Fear & Greed proxy model is spiking well into Greed territory