
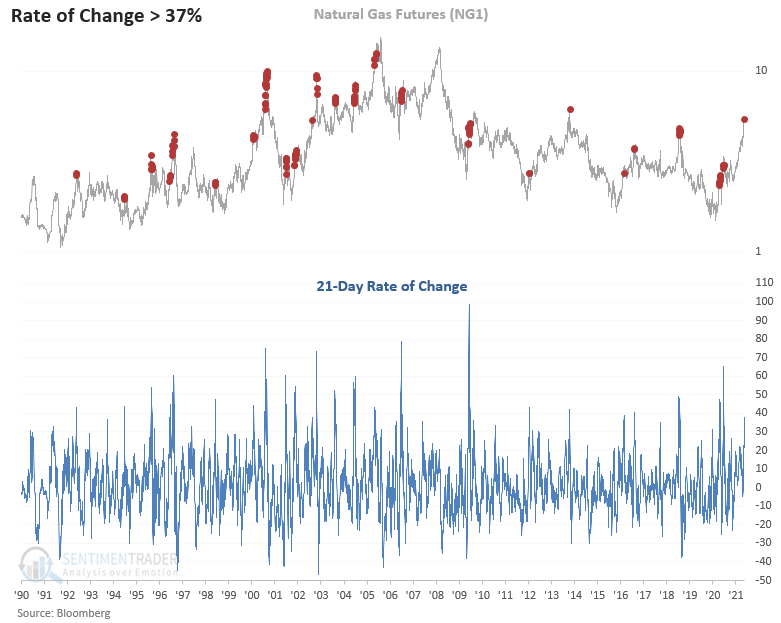
Natural Gas Prices Are Surging

Since the low on 6/25/2020, the continuous front-month natural gas futures contract has risen by 268%. And, in the latest trailing 21-day period, the commodity has increased by over 38%. So, what should we expect from here if we use history to guide our future outlook for gas prices?
Let's conduct a study to assess the outlook for natural gas prices when the 21-day rate of change crosses above 37%.
HISTORICAL CHART
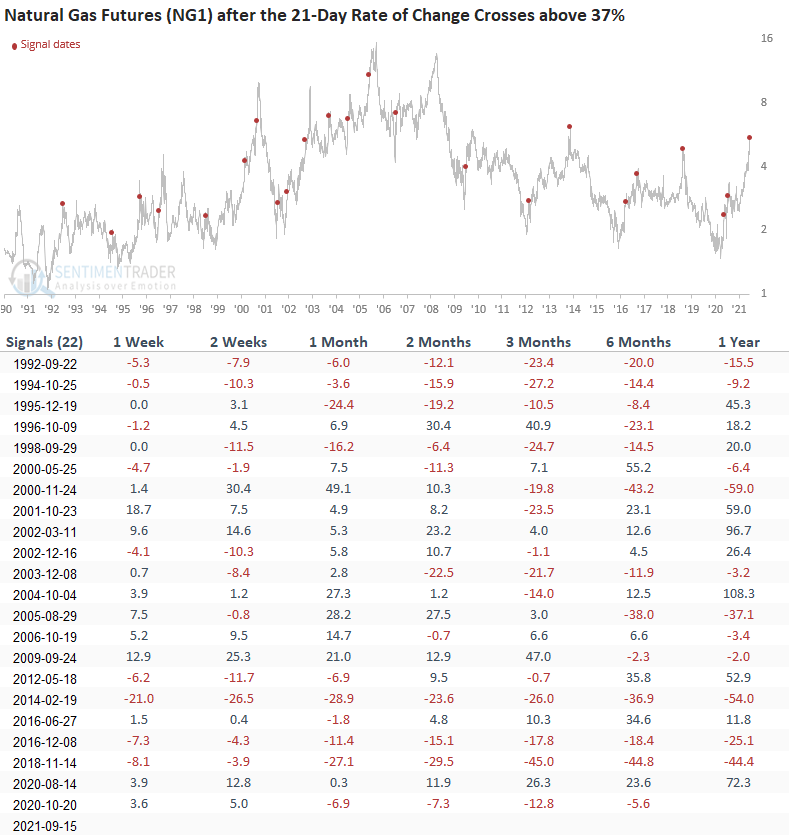
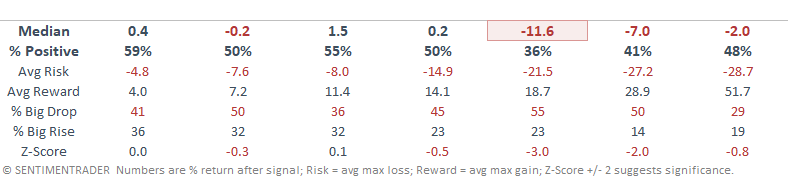
HOW THE SIGNALS PERFORMED
The first couple of months look like a coin toss. I would note that the 1-month period registered ten consecutive increases between 2000 and 2009. Once you get past the 2-month window, the returns look weak, especially the 3-month timeframe.
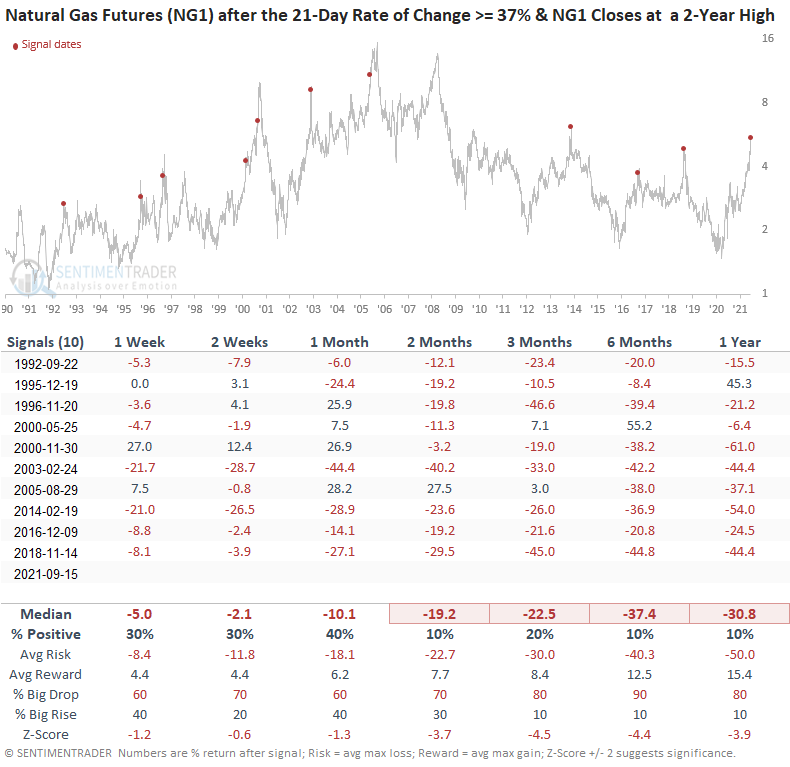
Let's add some context to the study. We will keep the rate of change parameter of 37% or greater and include a condition that the commodity closes at a 2-year high. The goal is to isolate historical instances similar to the current one.
HOW THE SIGNALS PERFORMED
Results look significantly weaker. I would add that a few instances showed some nerve-wracking gains in the first month.
The new condition shows that a big surge at multi-year highs is vastly different from a surge that occurs from a significant low in price.
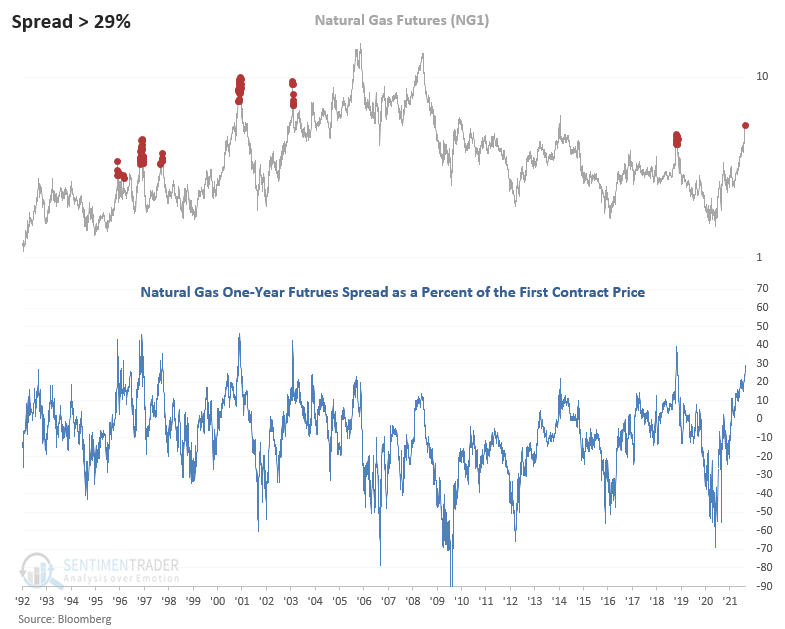
The natural gas one-year futures spread as a percent of the first contract price is an excellent indicator to assess a dislocation in the futures curve. Historically, a high spread identifies significant peaks in the commodity. In contrast, the commodity tends to form a substantial bottom when the spread falls to a low level.
With the spread increasing above 29% on 9/15/21, let's assess the forward return outlook for natural gas when it has crossed above that level in the past.
If you were wondering, this is how I calculate the spread.
Spread = (NG1-NG13)/(NG1)*100
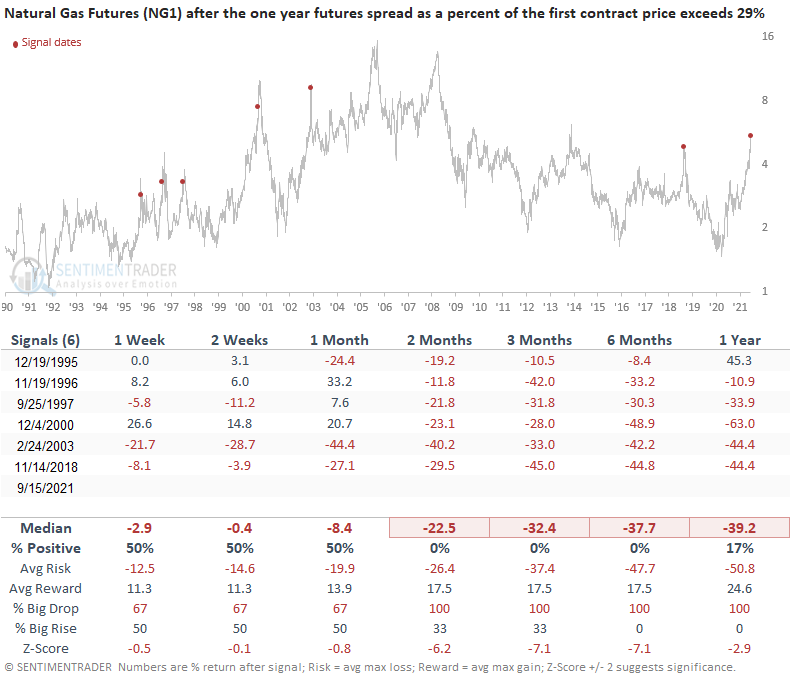
HISTORICAL CHART
HOW THE SIGNALS PERFORMED
Results are a coin toss in the short term with some substantial gains. Once you get past that timeframe, watch out below.
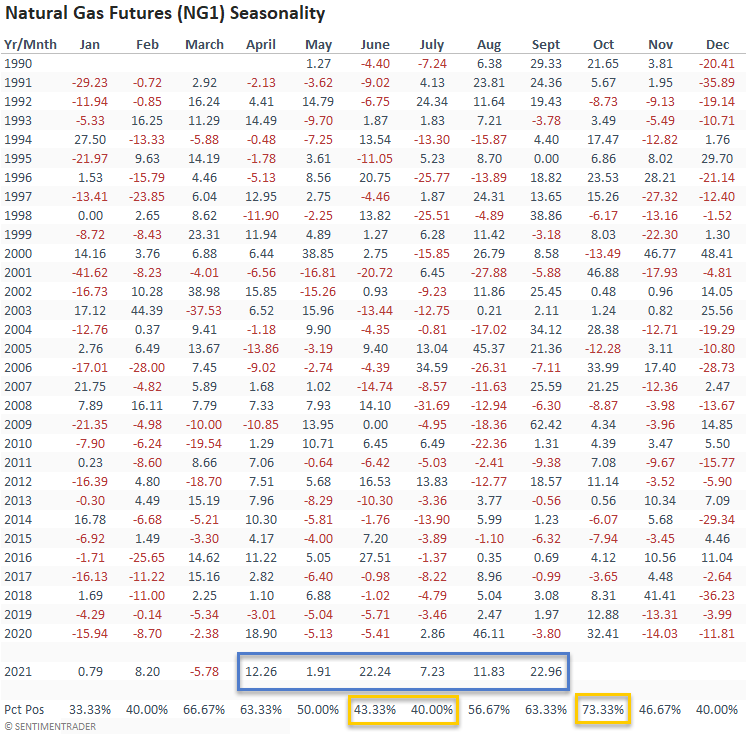
The following table shows the monthly percentage change for natural gas prices since 1990. The trailing 6-month period in 2021 has been spectacular. In case you didn't notice, gas prices have risen for six consecutive months between April and September. I'm assuming September closes up. That's a feat that has never occurred in history.
I think an essential key short-term takeaway is the positive seasonality trend in October. Even though today's studies suggest gas prices could struggle on a longer-term basis, one cannot rule out higher prices in the short term. A burst of cold weather in October or November could be a catalyst for further gains.
I calculated the September gain as of 9/15/21.
Suppose you were wondering how the current 6-month gain compares to history. In that case, the following chart shows instances when the rolling 126-day rate of change is above 111%.
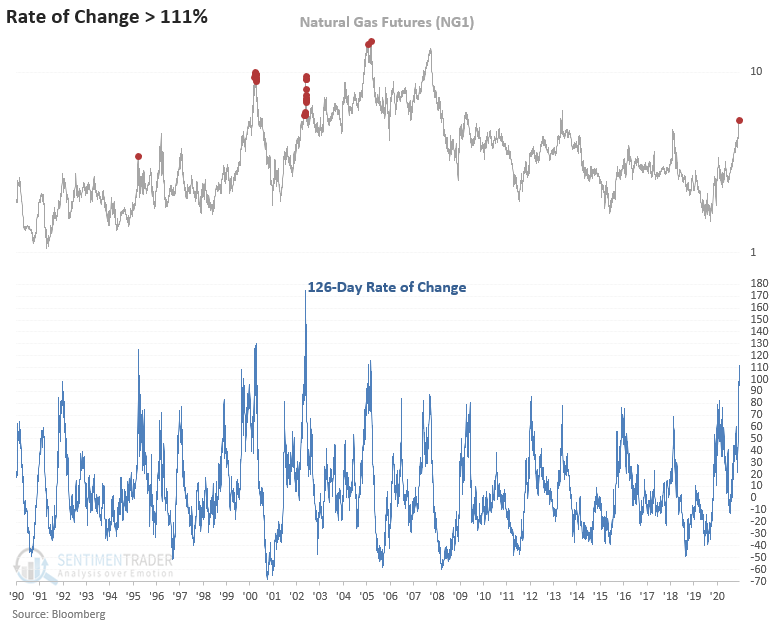
Please remember, the following study is not a recommendation. If anything, the study should help you make a more informed decision when your gas provider calls with a new lock-in rate.