
NASDAQ's momentum is weakening?
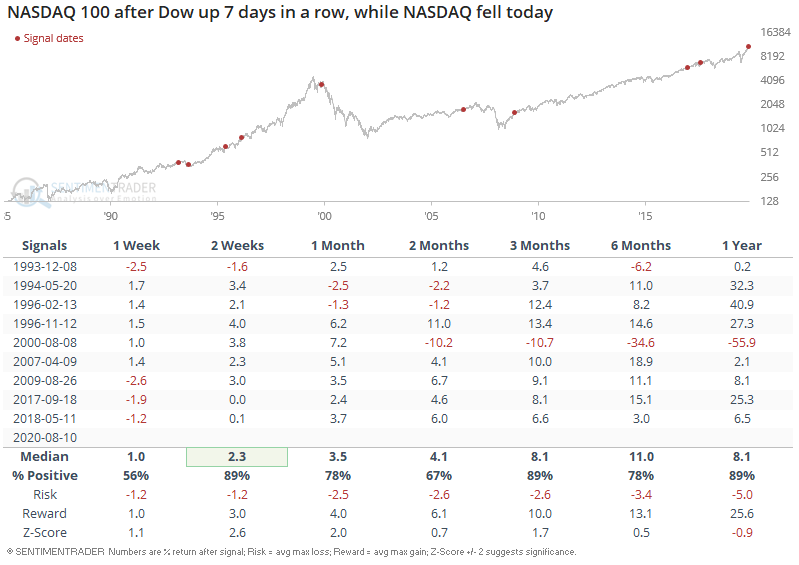
The NASDAQ's momentum was incredibly strong, and now looks like it could be weakening. As Helene Meisler and Urban Carmel alluded to, previously weaker sectors like the Dow Jones Industrial Average are catching up while previously stronger sectors like the NASDAQ 100 could be weakening. Is this a sign that the market's rally is over, considering that previous leaders could be losing steam?
When this happened in the past, this wasn't a consistently bearish factor for the NASDAQ on any time frame, particularly in the short term.
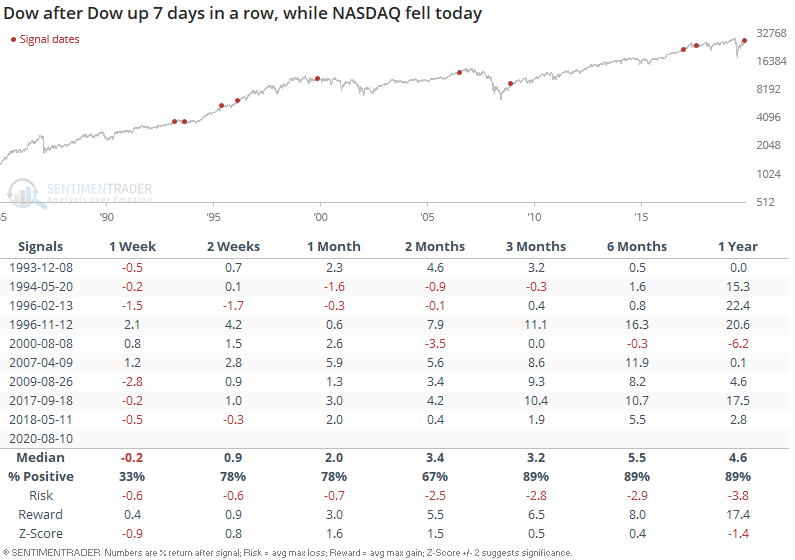
Likewise, it wasn't consistently bearish for the Dow past 1 week later:
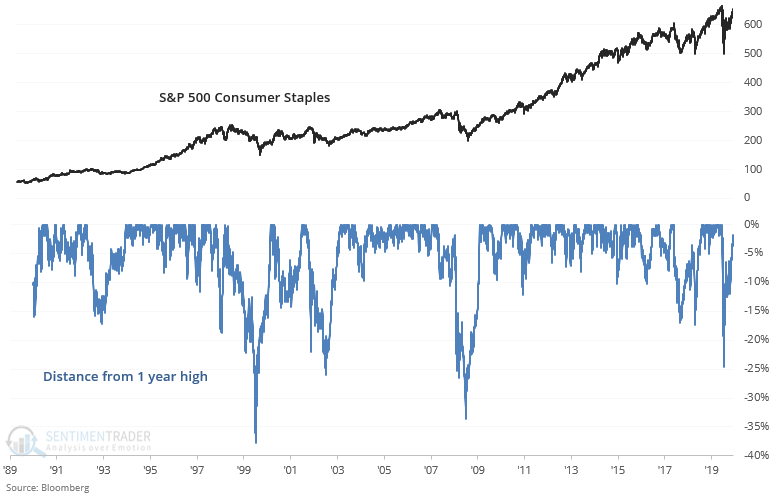
Sectors like consumer staples are catching up and are now within 2% of its prior all-time high:
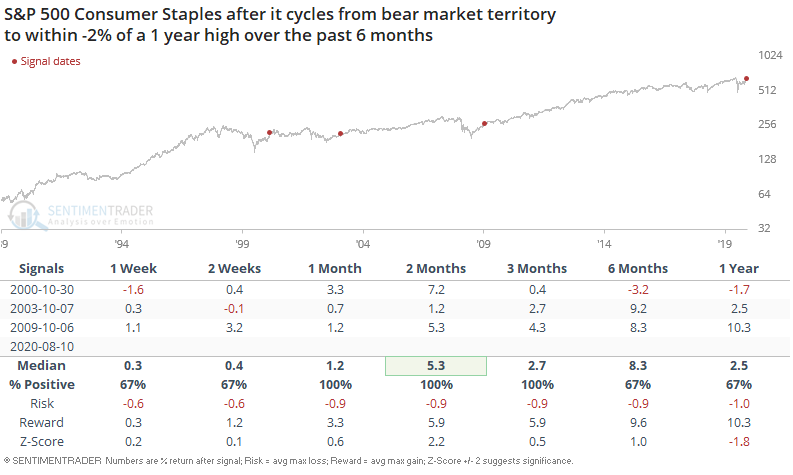
When this happened in the past, consumer staples usually pushed higher over the next 1-3 months:
The past few months have been a battle between contrarian (calling for the market to drop) vs. momentum (calling for the rally to continue). Thusfar, momentum has won out.
I was talking to one of the best traders I know, and we were discussing that from 2017-present, trend following traders as a group seem to have done better than contrarian traders. More importantly, we were talking about why this is, and some structural changes that have caused this shift. Only when you think about and understand these shifts can you improve your trading.
The market from 2017-present can be described by 1 simple phrase: extreme has become more extreme.
Short term and medium term moves are becoming more and more one directional without the ebb and flow that was so common from 2000-2016. This could be the reason why so many historical comparisons have not been too accurate
- Stocks went straight up in 2017.
- Stocks crashed pretty quickly in Q4 2018.
- Stocks went straight back up in early-2019. So many people called for a pullback, because "V bottoms are historically rare". The market didn't care, and it went straight back up without a retest of the bottom.
- Stocks rallied like crazy in late-2019 and early-2020. So many bears started calling the top from November - February.
- Stocks crashed in 1 straight line in February/March 2020. "Historically, the market crashed in waves". Now, the market went straight down.
- Stocks rallied in 1 straight line since March. This isn't "historically normal", but that's what happened. Tech stocks have witnessed INSANE momentum.
- This sort of craziness is not only confined to stocks. Look at gold and silver's rally. Silver tripled in a matter of months.
The bottomline is that from 2017-present, many historical short term extremes have become even more extreme. In my opinion this is the reason why many contrarian traders haven't done that well, whereas many short term trend followers have done well. I've seen arrogant social media personalities call the top from November 2019 - February 2020. Then when the market fell -8%, started calling for a bottom, only for the S&P to drop another -25%. These people will tell you just how right they were at the top and bottom, but when you look at their track record as a whole, has been no better than flipping a coin.
So what is causing this phenomenon of extremes becoming more extreme? No one knows for sure, but I do have some thoughts.
The world as a whole has become more extreme, and the internet (media, social media) has a huge role in this. Whether its politics or financial markets, the middle ground has become increasingly empty. The internet has proliferated wide spread echo chambers that do nothing except pound home on an existing trends and push these trends to even more extremes.
Politics is clear - we're at one of the most turbulent political periods since WWII, and plenty of studies have shown the polarization of peoples' political views.
You see this in markets as well. When 1 trend starts to rise (e.g. gold/silver going up), EVERYONE hops on the bandwagon. Speculators jump in, then Robinhood traders hear about this "once in a lifetime opportunity to 10x your money" from their favorite Youtube guru jump on the trend, and then your neighborhood dentist jumps on the trend too. Because if a kid watching videos on Youtube can 10x his capital, then surely a dentist with years of education should be able to as well.
My point isn't to say that contrarian indicators don't work any more. My point is that you might want to wait a little before you call the end to a trend. If before you would turn bearish when XYZ indicator reached X level, turn bearish when XYZ indicator reaches X+10 nowadays. If before you would turn bullish when XYZ indicator reached Y level, turn bullish when XYZ indicator reaches Y-10 nowadays. Otherwise, there's no point in calling a top for 4 months and calling a bottom when the S&P falls -5%, -10%, -15%, -20%, -25%, -30%. That doesn't do justice to your portfolio.