
Nasdaq signal with near-perfect record just triggered

Key points:
- The Nasdaq Composite's trend score jumped by four points over five trading sessions
- Similar trend shifts saw the technology-heavy index rise 94% of the time over the subsequent year
- The widely followed semiconductor industry also triggered a trend score net change buy signal
A bullish shift in trend-following indicators for the Nasdaq Composite
Our proprietary trend score indicators are an excellent resource for investors aiming to stay aligned with the prevailing market trend or spot early signs of a shift. By systematically measuring trend conditions across multiple timeframes and indicators, these composites help confirm trend strength and detect sharp reversals that often precede sustained rallies. Whether used to validate current leadership or anticipate potential turning points, the trend scores provide a data-driven foundation for disciplined, forward-looking investment decisions.
On Monday, the Nasdaq Composite's trend score jumped by four points over a five-day window, triggering a buy signal for the technology-heavy benchmark. The previous signal occurred in November 2023, leading to substantial gains over the next six months.
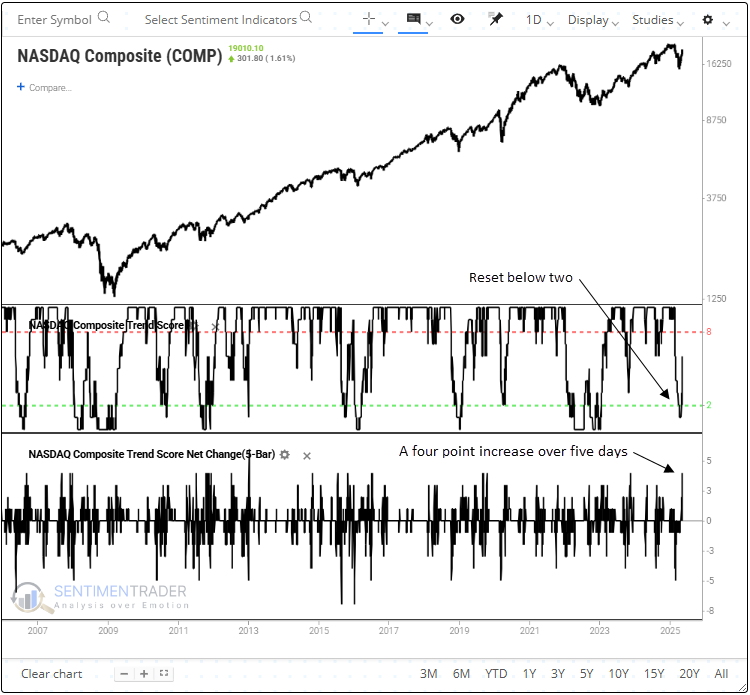
Two additional conditions must be satisfied to activate the signal. The trend score must first decline below a reading of two, and the index must exhibit positive short-term price momentum in conjunction with the net change surge.
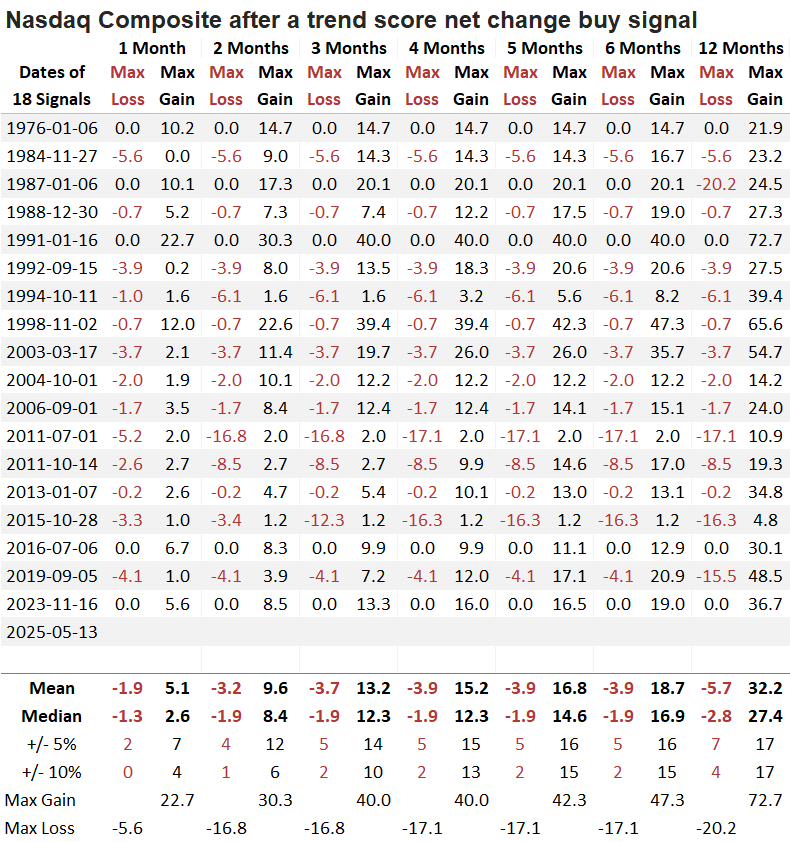
Comparable trend score shifts preceded outstanding returns
Whenever the Nasdaq Composite's trend score climbed by four points over five days, the technology-heavy index displayed outstanding returns and consistency over the next year. Furthermore, six out of seven horizons displayed significance relative to random returns.
The lone loss in the one-year time frame coincided with the 1987 crash, an outlier event.
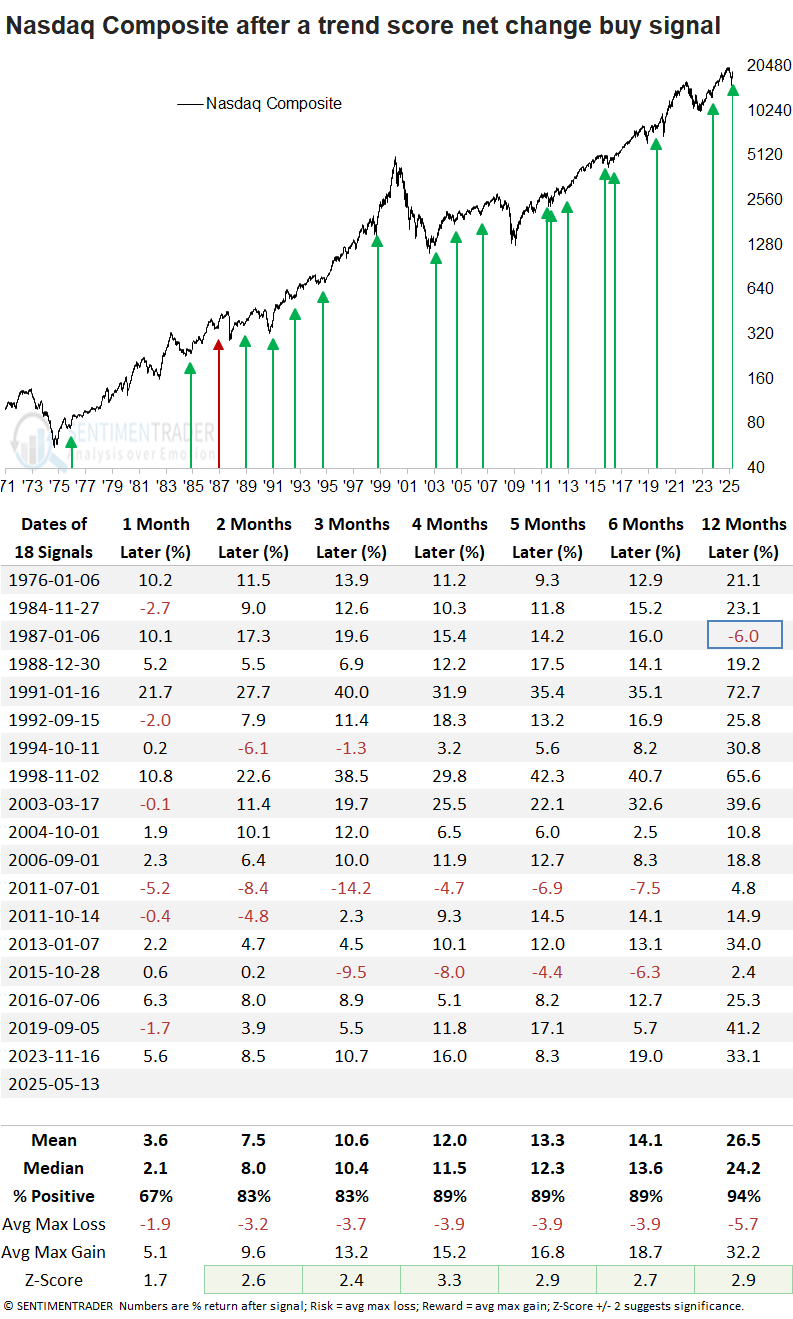
A year later, the Nasdaq Composite declined more than 10% only four times. In contrast, it posted rallies of over 10% in 17 out of 18 occurrences, suggesting a favorable risk/reward scenario.
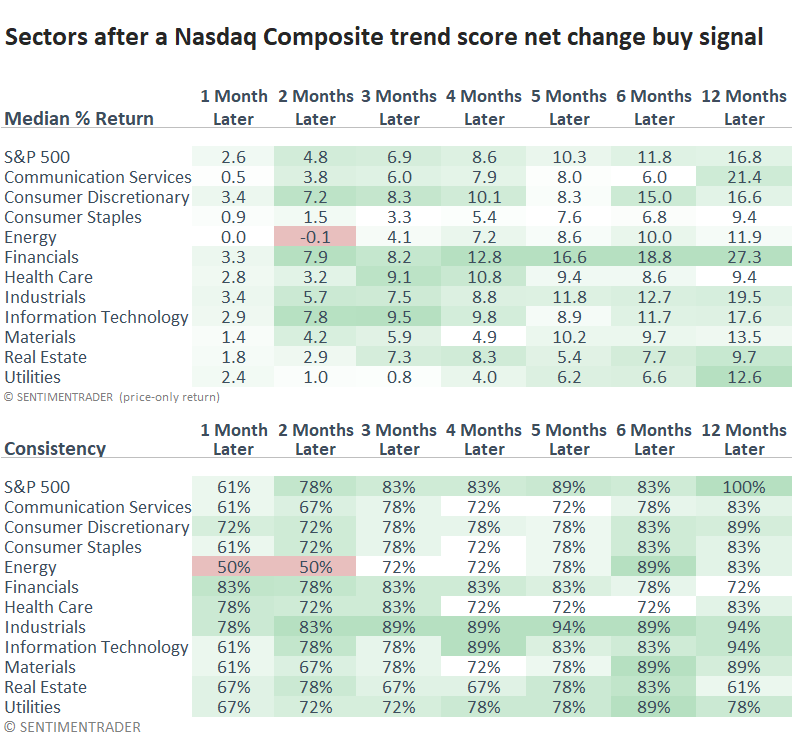
Cyclical sectors have historically outperformed defensive groups following Nasdaq trend shifts, a scenario likely to persist as markets transition from bearish to bullish conditions.
Other trend score surges
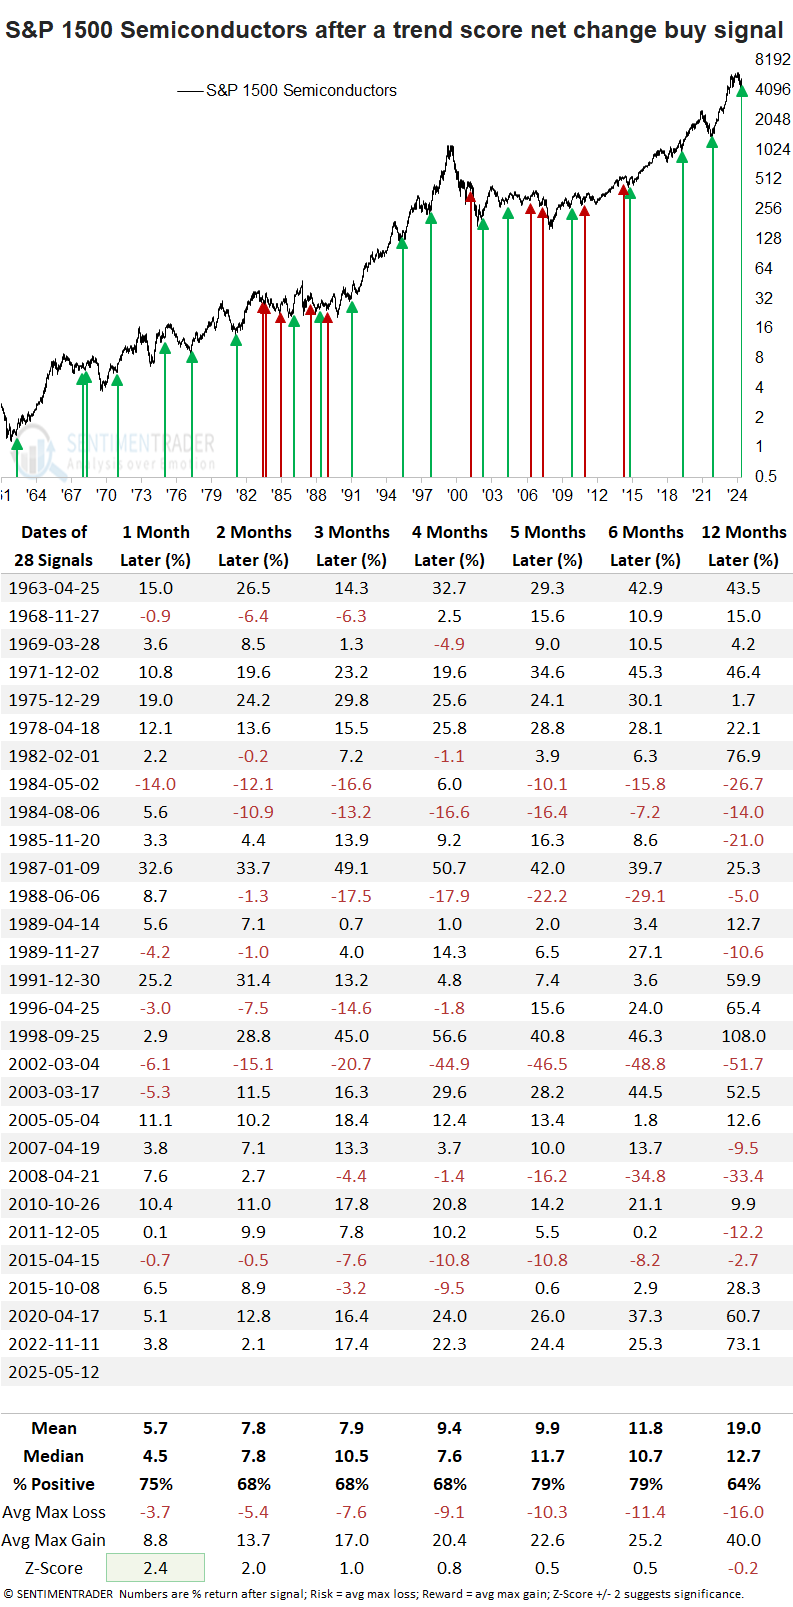
Semiconductors, an industry fueling the AI phenomenon, experienced a four-point increase in its trend score over five sessions, activating a buy signal.
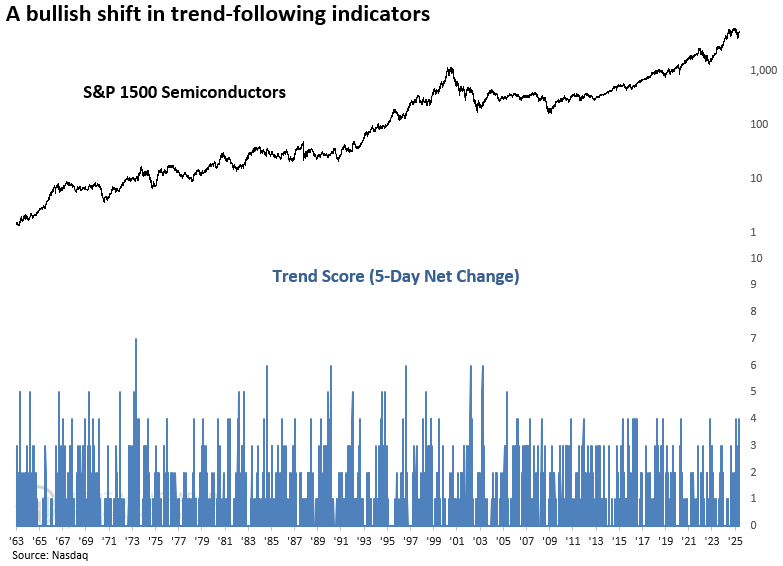
Following a trend score net change signal within the S&P 1500 Semiconductor sub-industry, chipmakers experienced one-month gains in 75% of cases and displayed statistically significant returns compared to random outcomes. Notably, consistency remained elevated over the medium term, with 79% win rates at the five- and six-month marks.
A choppy market environment between 1984 and 1989 created headwinds for the signal, which depends on persistent trends to be effective.
In my recent report, Technology Dominates the Relative Highs Breakout List, I highlighted that relative strength in software looked more favorable than semiconductors. Just a few days later, that dynamic is beginning to shift the other way.
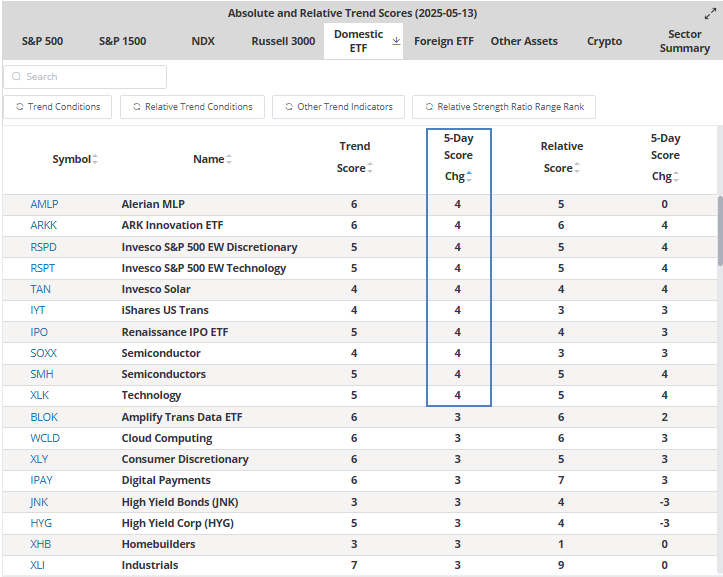
Trend score data
As a reminder, you can view thousands of trend score net change levels on our website's Trend Score page. As shown below in the Domestic ETF folder, most readings with a net change score of four are concentrated in technology-oriented ETFs.
What the research tells us...
The technology-heavy Nasdaq Composite triggered a Trend Score Net Change buy signal, reflecting a notable improvement in trend-following indicators. This positive shift in a broad-based index like the Nasdaq confirms the earlier bullish message from breadth-based indicators, which often lead price and signal internal market health before it becomes visible in the indexes themselves. This alignment between breadth and trend is a bullish development, typically observed as stocks and major indexes transition from a bearish to a more constructive, bullish phase. Semiconductors, a critical industry with technology, also triggered a net change buy signal with bullish implications for the group.