
NASDAQ Hindenburg Omen suggests rougher seas ahead

Key Points
- The Nasdaq Hindenburg Omen has a history of foreshadowing periods of stock market struggles
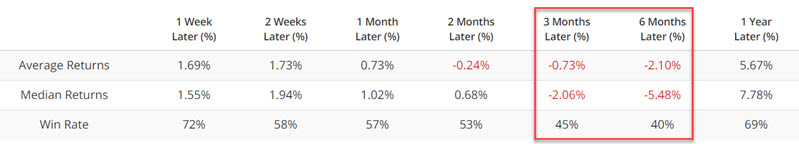
- Recent action suggests investors should brace for a tougher environment over the next 3-6 months
The Nasdaq Hindenburg Omen
Earlier, Jason touched on the cluster of technical warning signs that triggered over the past week. Here, I want to go more in-depth specifically about the Hindenburg Omen for the Nasdaq.
The Omen is a technical warning sign created by James Miekka in the 1990s, based on work from Norman Fosback in the 1970s. It monitors conditions that analysts have looked at throughout history as signifying potential weakness underlying the market. On the site, we calculate it for both the NYSE and Nasdaq exchanges.
We use three criteria, which may differ from other sources:
- The Nasdaq 100 is above its 50-day moving average
- Both new 52-week lows and 52-week highs on the Nasdaq are greater than 2.8% of all advancing and declining issues
- The Nasdaq McClellan Oscillator is negative
When the signal triggers, it highlights a "split" market, which is unhealthy. Multiple signals in a cluster are a worrying sign. Traditionally, the signal is canceled after 30 days or if the Oscillator turns positive again, though we've seen that it can lead to market trouble several months in advance.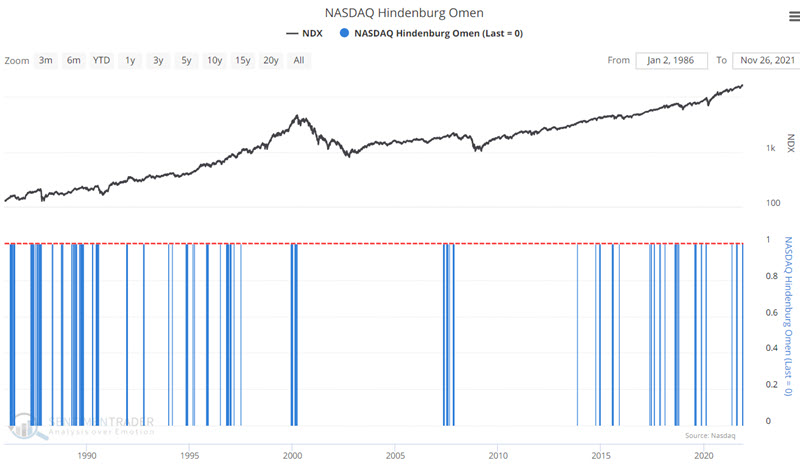
Highlighting meaningful warnings
A single random Hindenburg Omen is typically not meaningful on its own. However, when three consecutive days register the same warning, the Nasdaq 100 tends to struggle for 3-6 months.
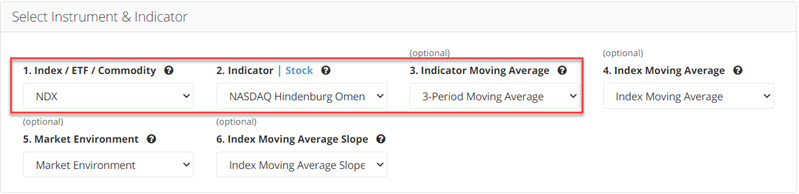
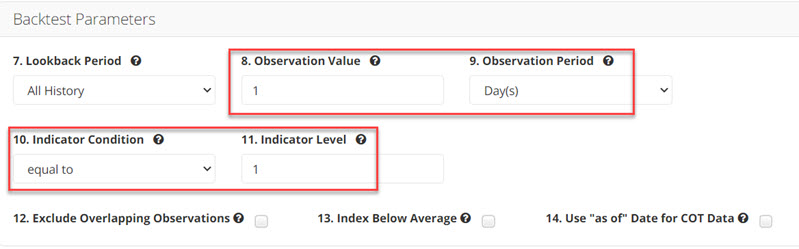
The criteria we will use is a 3-day average equal to 1, meaning three consecutive days all meeting the Hindenburg criteria. For this test, we will include overlapping signals. The input screens appear below. You can run this test by clicking here.
The output chart appears below. The red dots highlight three consecutive days of valid Nasdaq Hindenburg Omens.
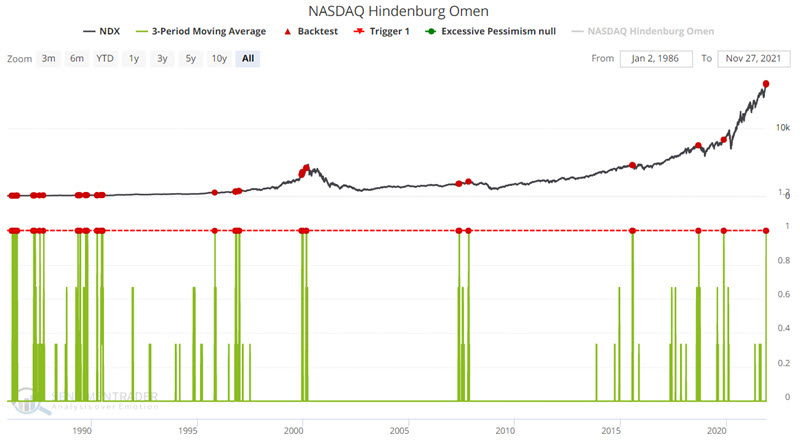
The results show a strong tendency for weakness in the NDX over the next 3 to 6 months. The most recent signals occurred on 11/18, 11/19, and 11/22.
What the research tells us…
It is essential to understand what this signal does and does not imply. What it does not imply is that a massive bear market is necessarily in the offing. What it does imply is that the next 3 to 6 months are far less likely to be the type of smooth sailing that stock market investors have gotten very comfortable with over the last 12+ months. Stock and strategy selection are likely to be much more critical in the months ahead