NASDAQ High/Low ratio

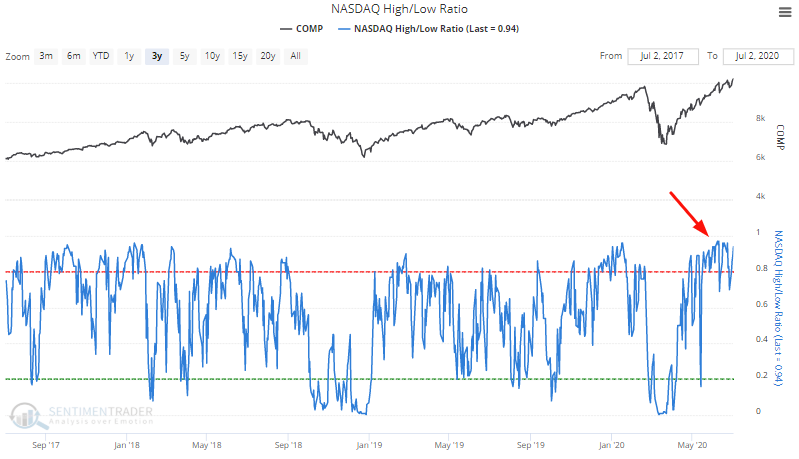
The endless ramp higher in tech stocks has pushed many members of the NASDAQ to 52 week highs. The NASDAQ High/Low ratio has consistently hovered around 1, meaning that far more tech stocks are at 52 week highs than at 52 week lows.

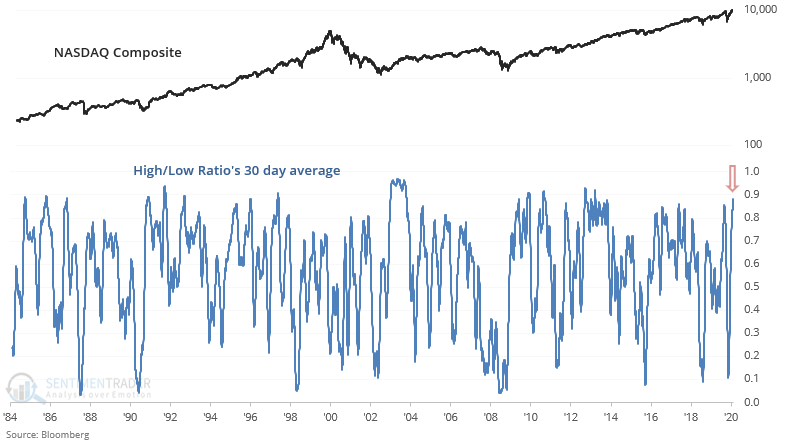
The High/Low Ratio's 30 day average is at its highest level in years: higher than where it was before the March 2020 crash, and higher than where it was before 2017's ramp higher ended in late-January 2018.

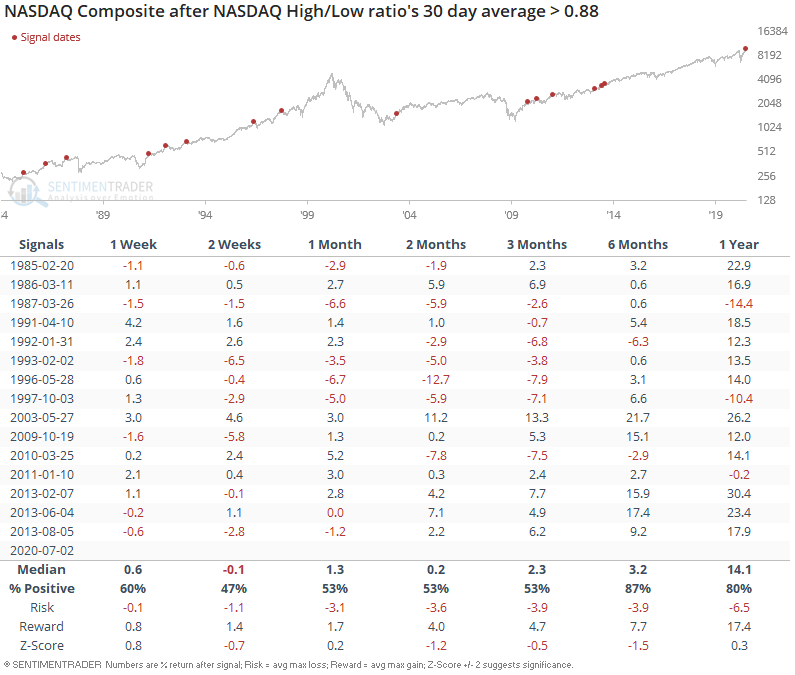
When the High/Low Ratio's 30 day average was this high in the past, the NASDAQ Composite's returns over the next few weeks and months were consistently more bearish than random (although it wasn't a very strong bearish factor).

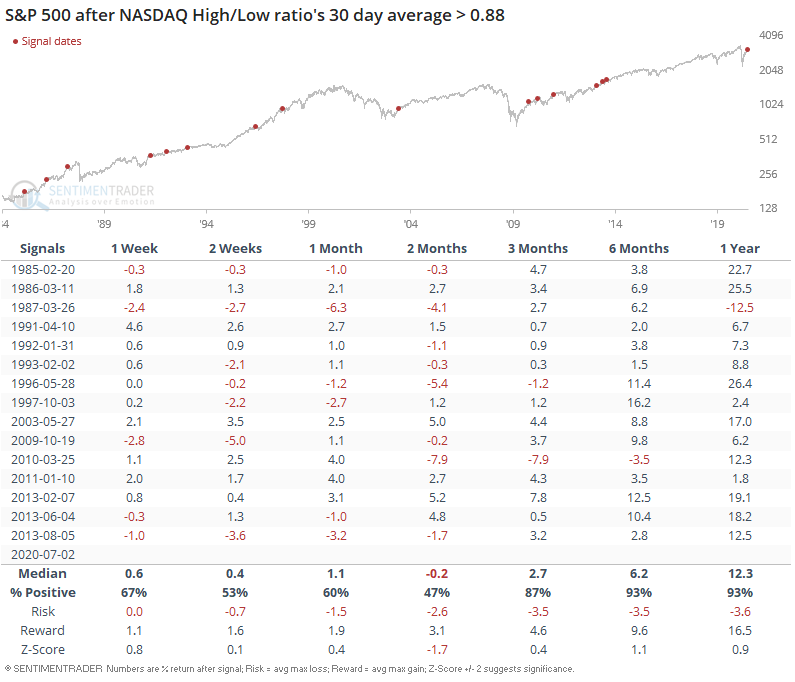
Similarly, this led to weaker-than-average returns for the S&P 500 over the next 2 months. With that being said, extremely strong tech breadth usually led to more gains for the U.S. stock market over the next 6-12 months.

