
Moving beyond optimism to euphoria

If you're invested in one of the groups that has skyrocketed in the past couple of weeks, then it would only be human nature to feel a little giddy. Euphoric, even.
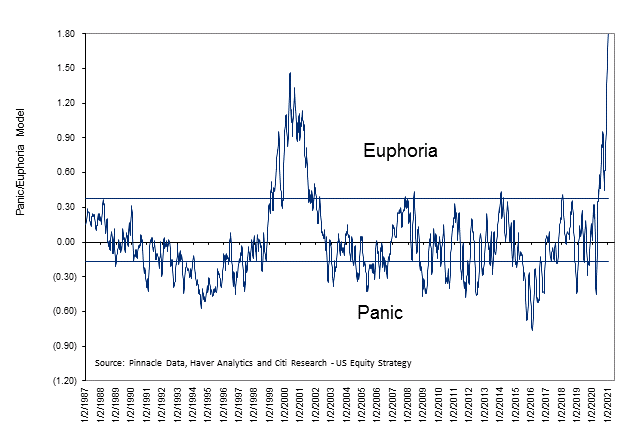
Based on a popular model, that's exactly how many investors are feeling at the moment, as the Citi Panic / Euphoria model has soared to a record high.
When we looked at this in June, we noted that based on publicly released data, the model's inputs are somewhat unusual. It includes:
- NYSE short interest
- Margin debt
- Nasdaq vs NYSE volume
- Investor's Intelligence survey
- AAII survey
- Retail money market funds
- Put/call ratios
- Commodities prices
- Gasoline prices
And that based on those criteria, we'd make assumptions that the following extremes would show euphoria:
- High optimism in the AAII and II surveys (investors think stocks will rise)
- Low put/call ratio (options traders betting on rising prices)
- Low short interest ratio (short-sellers covering bets against the market)
- High margin debt (investors pledging shares against loans)
- High Nasdaq volume relative to the NYSE (speculative fervor)
- Low retail money market fund assets (investors see no need for cash cushion)
- High commodities prices (bets on economic growth)
- High gasoline prices (lots of mobility as the economy hums)
We adjusted the lookback we used to create the proxy model, and it follows the published one a bit better but is still not as extreme.
The chart below shows a fairly clear contrary nature to the model - when it's high, the S&P's returns over the next year tend to be low; when the model is low, the S&P's returns are high.
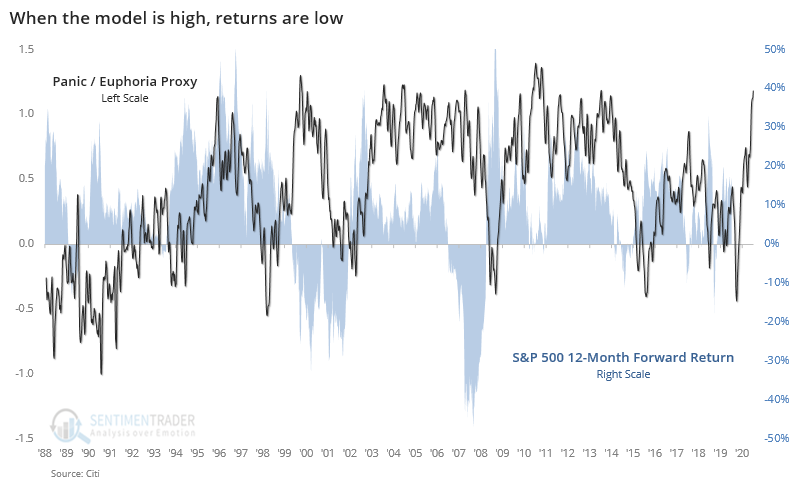
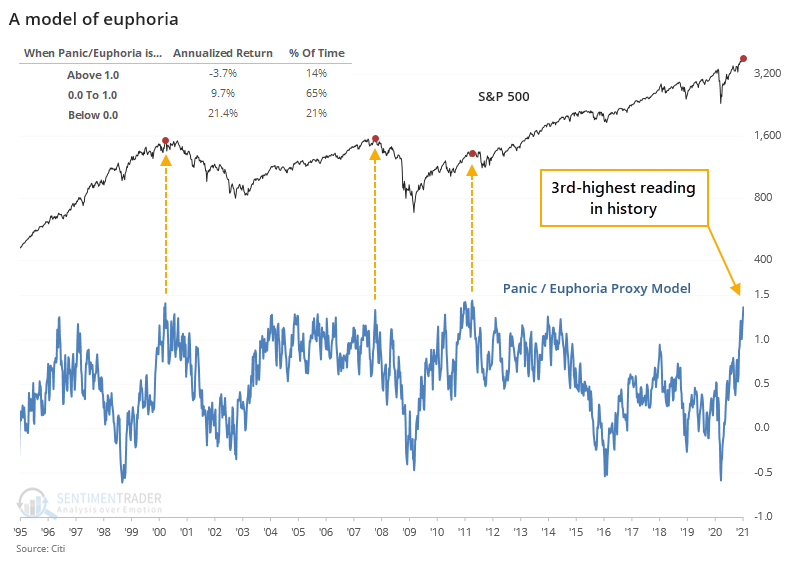
Whenever this proxy was above 1, occurring about 14% of the time since 1988, the S&P 500 returned an annualized -3.7%, compared to an impressive +21.4% when it was below zero.
Even though this proxy isn't as extreme as the one shown above, it did just record the 3rd-highest reading in 30 years.
Not surprisingly, forward returns after those peak euphoria readings were stomach-turning.
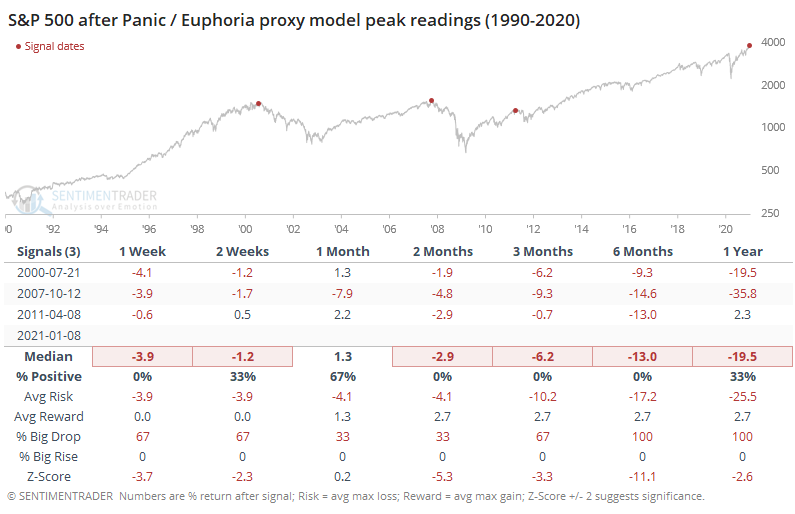
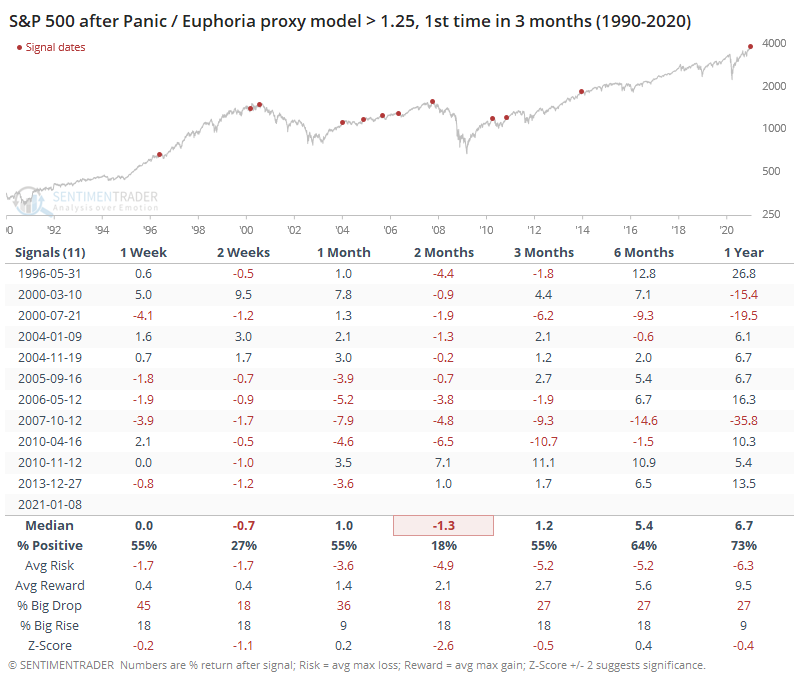
Even if we use lesser extremes, times when the average input was more than 1.25 standard deviations above its average, it preceded terrible returns over the next 2 months.
The biggest difference between now and most of those other signals is quality and momentum. As we saw on Friday, there have been tremendous thrusts underlying the market (though with some recent, isolated oddities that are troubling). As Dean pointed out, the S&P's recent new highs have been high-quality, not yet showing anywhere near the kind of deterioration we saw at other euphoric peaks.
The setup is ripe for a sustained pullback, and risk appears high relative to reward. We're just not quite seeing the kind of consistent internal weakness that preceded most of the sustained and deep corrections following other overly-optimistic-to-euphoric bouts of sentiment.