Moving Averages: everything you need to know
Moving averages are among the most widely used trend following indicators that demonstrate the direction of the market's trend. There are several different types of moving averages with the 2 most popular being the simple moving average (aka "sma") and the exponential moving average (aka "ema"). Of these 2 moving averages, the simple moving average (sma) is more commonly used. In this guide I will show you exactly how traders use moving averages and how well this indicator works when trading. In this post I'll share with you:
- What are moving averages and how are they calculated
- How traders use moving averages
- Skepticism towards moving averages
- Exactly how useful are moving averages? Let's look at the data and facts instead of the hype that a lot of online financial marketers peddle.
- What is the best moving average setting for various markets? Let’s look at the data
What are moving averages and how are they calculated
Purpose: A moving average seeks to identify the market's trend by calculating an average of the market's price over recent periods. By looking at the market's price over the past n periods, the moving average smooths out the market's price and cuts down on noise by ignoring day-to-day market fluctuations.
There are 2 factors to consider when it comes to moving averages:
- What type of moving average?
- How many n periods should the moving average include?
Types of moving averages
There are several types of moving averages, and the 2 most popular are the simple moving average (aka "sma") and exponential moving average (aka "ema"). The simple moving average is more popular than the exponential moving average.
Simple moving average
The simple moving average = (sum of the market's price over the past n periods) / (number of periods). Due to the way it's calculated, the simple moving average puts equal emphasis on every n period's price.
"N periods" can be anything. You can have a 200 day simple moving average, a 100 hour simple moving average, a 50 day simple moving average, a 26 week simple moving average, etc. As a general rule of thumb:
- 200 day simple moving average represents the market's long term trend
- 50 day simple moving average represents the market's medium term trend
- 20 day (or 10 day) simple moving average represents the market's short term trend
Here's an example of a 10 day simple moving average:
- Day 1 market price = $5
- Day 2 market price = $4.9
- Day 3 market price = $4.4
- Day 4 market price = $5.2
- Day 5 market price = $5.5
- Day 6 market price = $5.9
- Day 7 market price = $6.1
- Day 8 market price = $5.8
- Day 9 market price = $6.2
- Day 10 market price = $6.4
The sum of the market's price over these 10 days is $55.4, and since there are 10 "periods", the 10 day simple moving average = $5.54
Here's an example of the S&P 500's 200 day moving average:
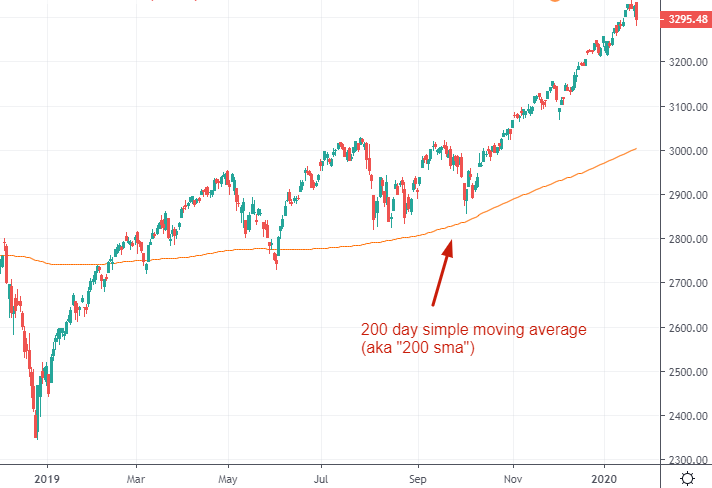
*All charts courtesy of TradingView
Moving averages can be used on any time period: hourly charts, daily charts, weekly charts, monthly charts, etc. We'll be using daily moving averages throughout the rest of this post.
Exponential moving average
Unlike a simple moving average, an exponential moving average DOES NOT put an equal emphasis on every day's price over the past n periods. It puts more emphasis on recent price and less emphasis on the market's price from longer ago. As a result, an exponential moving average "hugs" the market's price more closely when the market is trending. Here's an example of the slight difference using an 100 ema on the S&P 500 from 2018-2019:
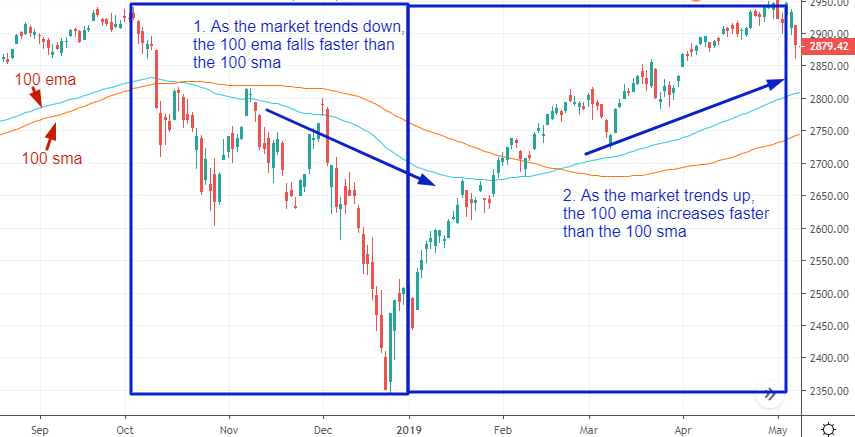
Since the simple moving average is more widely used than the exponential moving average, I will not be delving into how the ema is calculated in this post. I'll talk about exponential moving averages in more detail in a follow-up post.
When I refer to "moving averages" throughout the rest of this post, I'm talking about simple moving averages.
How traders use moving averages
There are many ways to use moving averages when trading. Since the number of moving average strategies is countless, I'm going to group them into 3 main types of strategies and look at the most common strategies:
- Trend following strategies
- Mean reversion strategies
- Trend filter strategies
Trend following moving average strategies
Most traders use moving averages in trend following strategies. This means that traders will buy when the market is in an uptrend and sell when the market is in a downtrend. In doing so, the trader hopes to ride the trends and profit from them.
There are 3 main trend following strategies:
- Buy when the market is above its moving average and sell when the market is below its moving average
- Buy when the market's moving average is going up and sell when the market's moving average is going down
- Buy when a shorter moving average crosses above a longer moving average and sell when a shorter moving average crosses below a longer moving average. This is also called a "moving average crossover" trading strategy
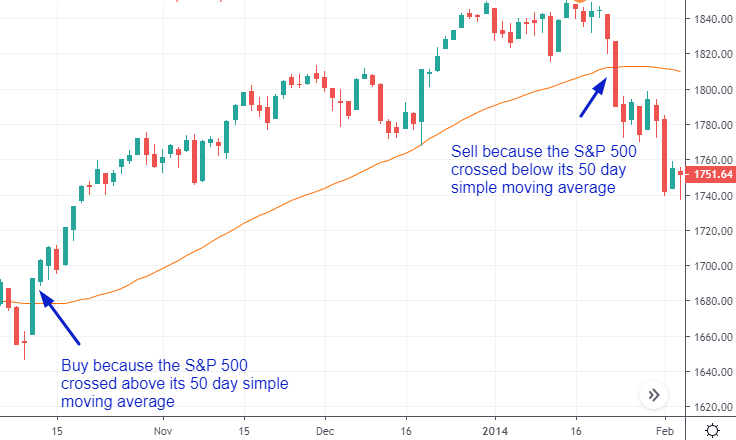
Here's a bullish example of the first moving average trend following strategy: buy when the S&P 500 crosses above its 50 sma, and sell when the S&P crosses below its 50 sma:
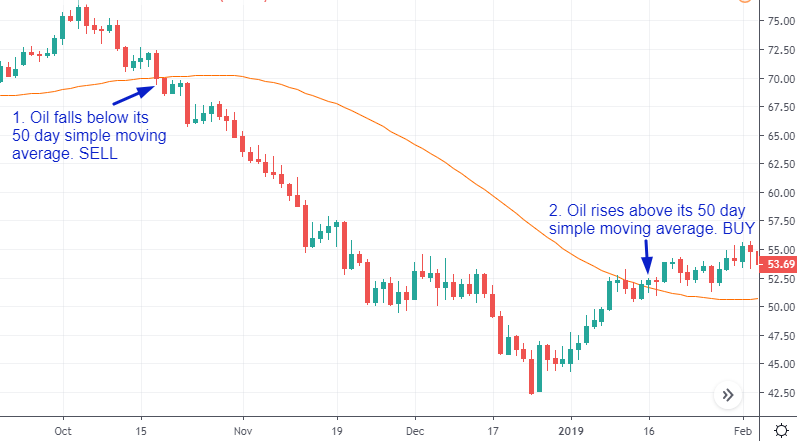
Here's a bearish example of the first moving average trend following strategy: sell when oil falls below its 50 sma, and buy when oil rises above its 50 sma:
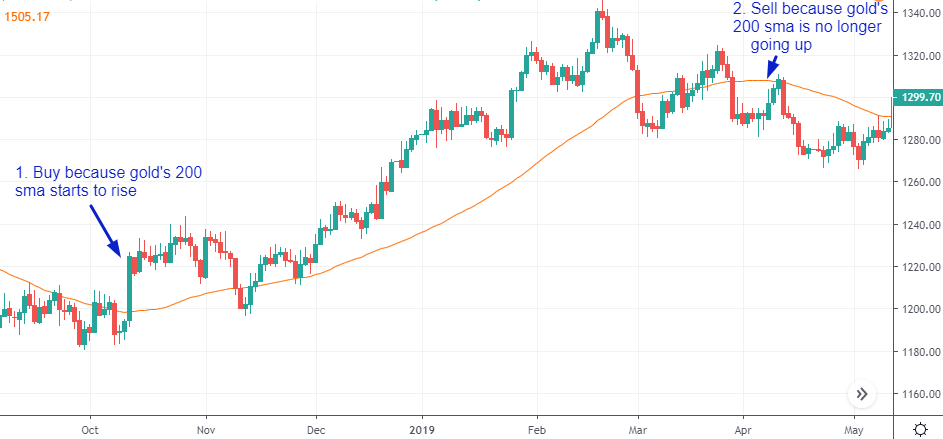
Here's a bullish example of the moving average second trend following strategy: buy gold when its 200 day simple moving average is rising, and sell gold when its 200 sma stops rising:
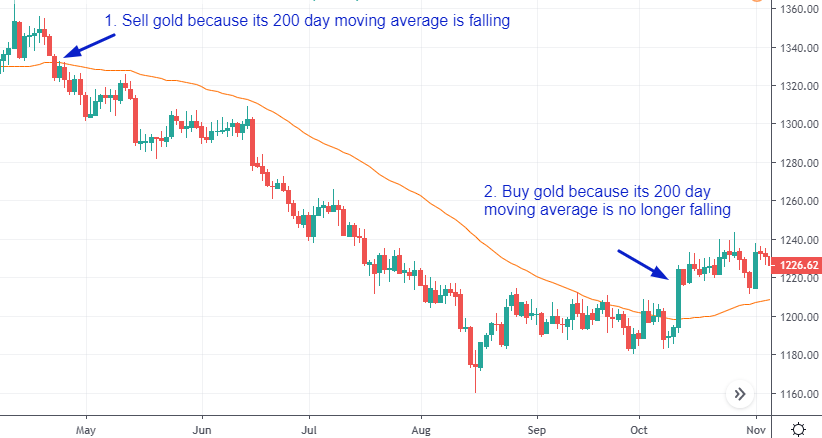
Here's a bearish example of the moving average second trend following strategy: sell gold when its 200 day simple moving average is falling, and buy gold when its 200 sma stops falling:
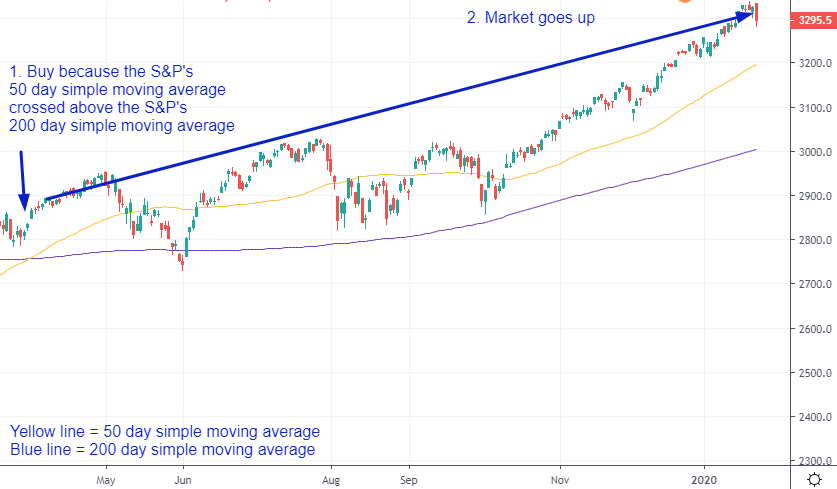
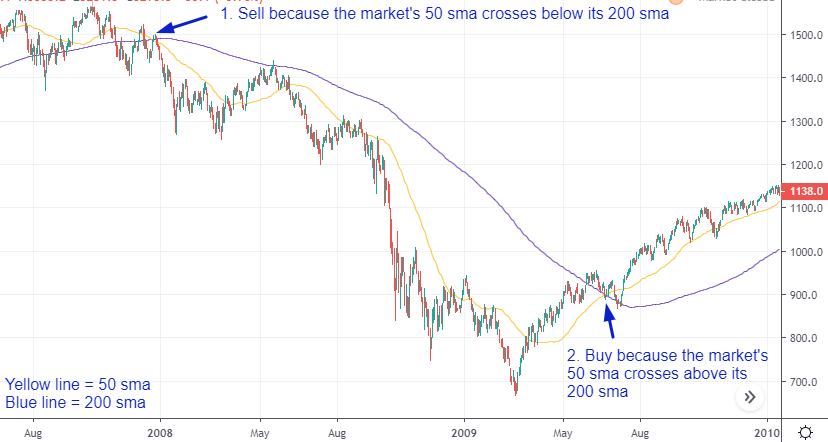
And finally, here's a bullish example of the third moving average trend following strategy: buy when the S&P's 50 day simple moving average crosses above the S&P's 200 day simple moving average, and sell when the 50 sma falls below the 200 sma
Here's a bearish example of the third moving average trend following strategy: sell when the S&P's 50 sma crosses below its 200 sma, and buy when the 50 sma rises back above the 200 sma:
Watch this video to see how to use Python code for algorithmic trading models to create trend following moving average strategies.
Mean reversion moving average strategies
While most traders use moving averages for trend following, they can also be used for mean reversion (contrarian trading). The underlying belief behind mean reversion is simple. Contrarian traders believe that:
- When the market has rallied "too much", it'll soon fall
- When the market has fallen "too much", it'll soon rally
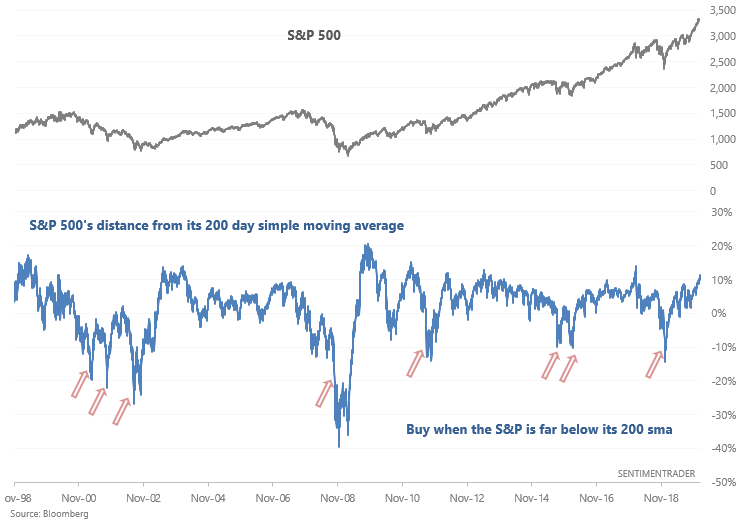
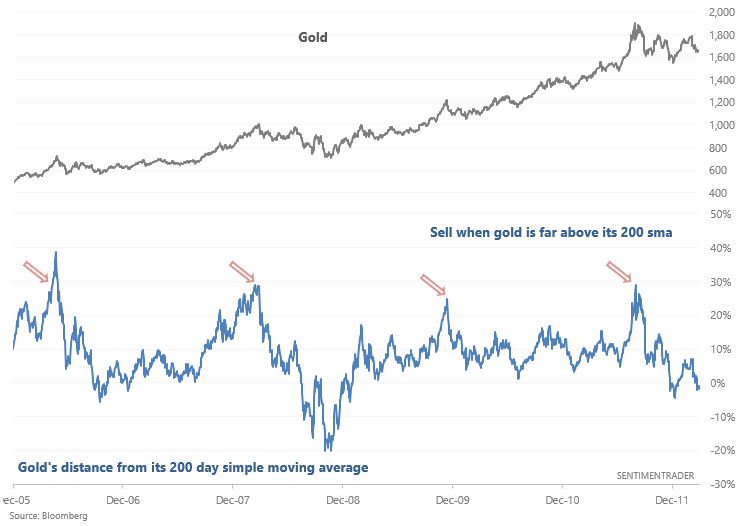
We can use the market's distance from its moving average to quantitatively define the term "too much". For example, we can calculate the S&P 500's distance from its 200 day simple moving average. A contrarian trader will:
... buy when the market has fallen significantly below its 200 day simple moving average:
... sell when the market is significantly above its 200 day simple moving average:
Trend filter moving average strategies
And lastly, you can use moving averages in combination with other indicators as a trend filter. This makes the signal from other signals more accurate since it's generally better to look for bullish trades when the market is trending up and look for bearish trades when the market is trending down.
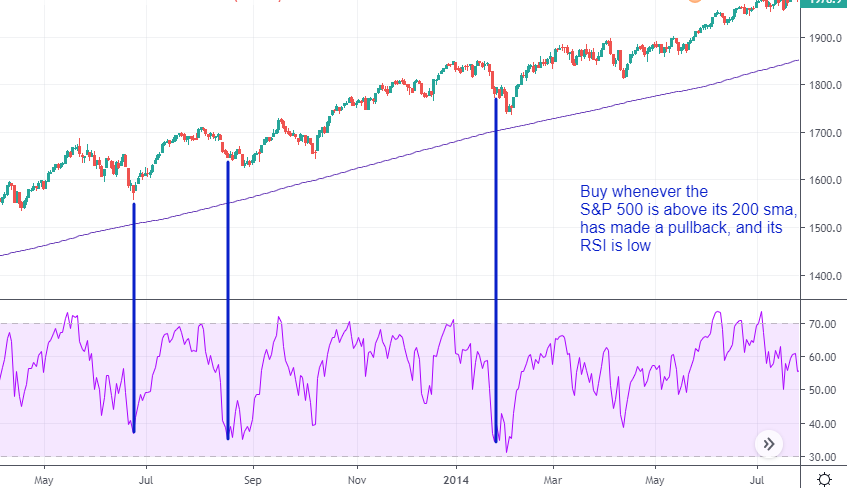
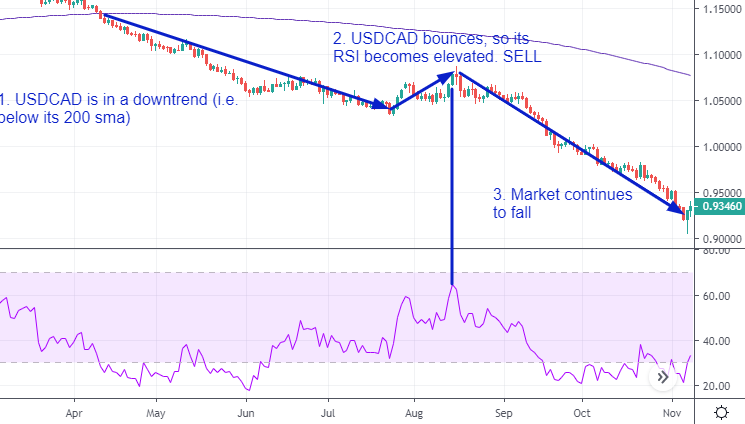
For example, you can combine the market's 200 day simple moving average with RSI so that you:
- Go long when the market is above its 200 sma (i.e. market is trending up), and RSI is oversold (i.e. market made a pullback during an uptrend)
- Go short when the market is below its 200 sma (i.e. market is trending down), and RSI is overbought (i.e. market made a bounce during a downtrend)
Here's an example of combining the S&P 500's 200 sma with RSI to produce a bullish trade:
Here's a bearish example:
Potential problems with using moving averages in trading strategies
These moving average strategies are not "secrets" (most "secrets" from trading gurus are simply re-packaged information from other trading books and websites). However, most websites and books only show you the cases in which moving averages result in successful trades, and don't show you when moving averages lead to failed trades.
Knowing when an indicator will NOT work is just as important as knowing when an indicator WILL work, since no indicator works 100% of the time. So before we strip away the financial industry's marketing hype and look at EXACTLY how useful moving averages are when trading, let's first examine some reasons why moving averages may not work.
Why trend following moving average strategies might fail
No matter how you slice and dice it, moving average trading strategies don't work very well when the market is extremely choppy. This is normal - trend following will lead to a lot of small losses when the market doesn't have a clear trend.
Here's an example of a failed trade when you "buy when the market is above its moving average":
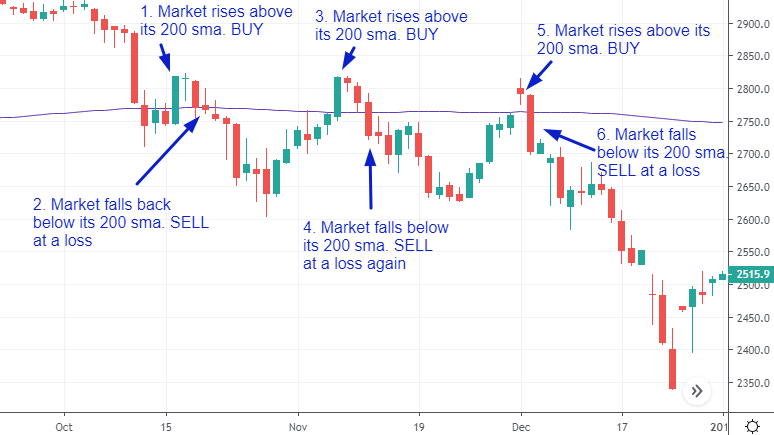
Here's an example of a failed trade involving moving average crossovers "buy when the market's 50 sma rises above its 200 sma, and sell when the market's 50 sma falls below its 200 sma":
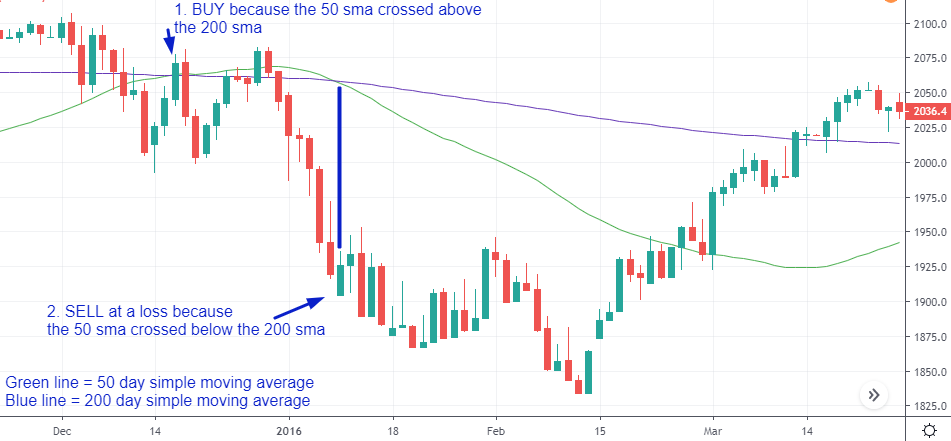
Why mean reversion moving average strategies may lead to failed trades
There is no such thing as:
- Just because the market has fallen "too much", it MUST rally
- Just because the market has risen "too much", it MUST fall
This means that just because the market has fallen significantly below a moving average (e.g. 200 sma), doesn't mean that it MUST rally. Perhaps the market will fall even more in the short term before it bounces. While the market does eventually bounce, the short term decline can be very painful and may even last a long time before the market "eventually" bounces.
The opposite is also true. Just because the market is significantly above a moving average (e.g. 200 sma), doesn't mean that it must fall. Perhaps the market will rally even more before it peaks.
How useful are moving averages for trading?
Now that we've looked at several moving average trading strategies, let's examine how well they work with data and facts. We'll primarily focus on the trend following strategies. The strategies we'll examine are:
- Buy when the market is above its moving average and sell when the market is below its moving average
- Buy when the market's moving averages form a bullish crossover and sell when the market's moving averages form a bearish crossover
- Buy when the market is in an uptrend and its RSI becomes low, and sell when the market is in a downtrend and its RSI becomes high
We're going to apply these 3 strategies to 3 different markets: the S&P 500, gold, and the U.S. Dollar Index. You can test these strategies on any market you want, but for the sake of keeping this post brief, we'll stick to these 3 markets.
*Most forex traders don't trade the U.S. Dollar Index - they trade specific forex pairs. But the U.S. Dollar Index does correlate with many currency pairs, so if you're a forex trader then please use the following data for demonstration purposes only.
*All strategies here use daily moving averages.
Data and facts for strategy #1: buy when the market is above its moving average and sell when the market is below its moving average
For the S&P 500
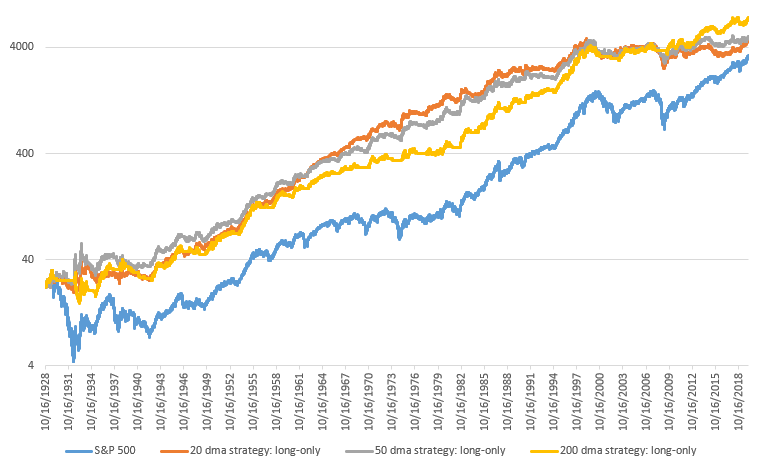
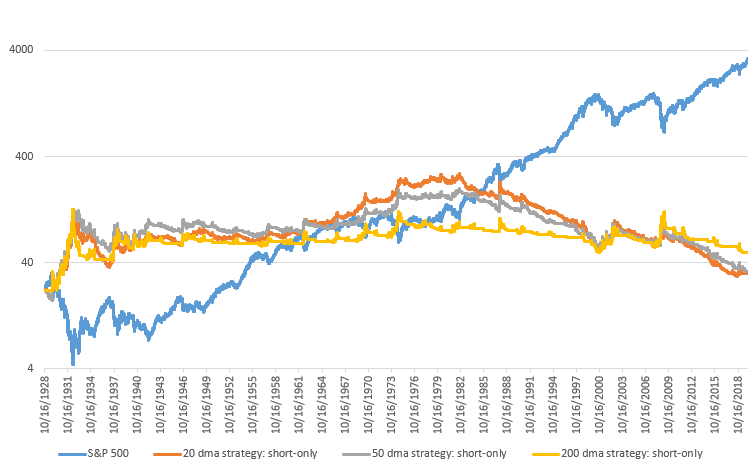
Here's what happens when you:
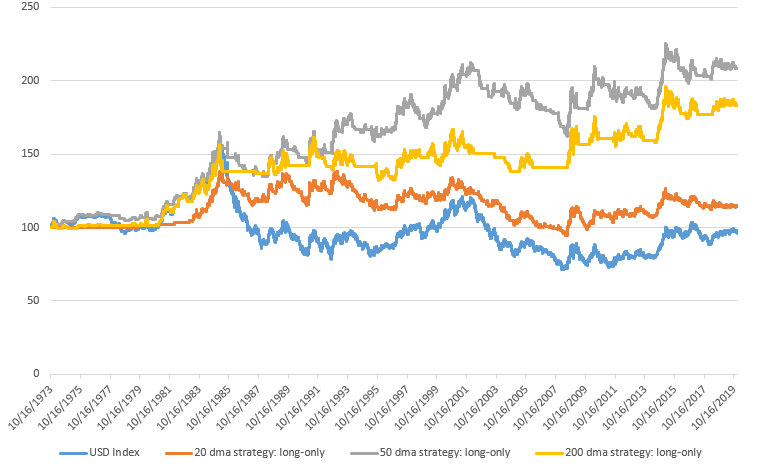
- Long-only strategy: only buy when the market is above its 20 sma, 50 sma, or 200 sma
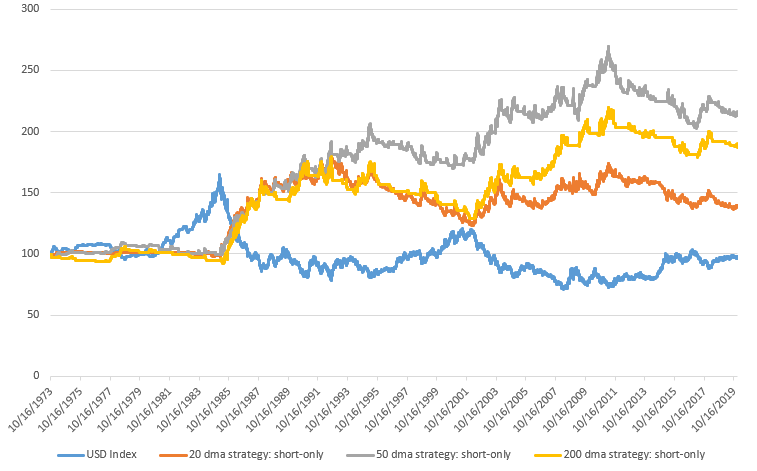
- Short-only strategy: only short when the market is below its 20 sma, 50 sma, or 200 sma
Long only:
Short only:
For gold
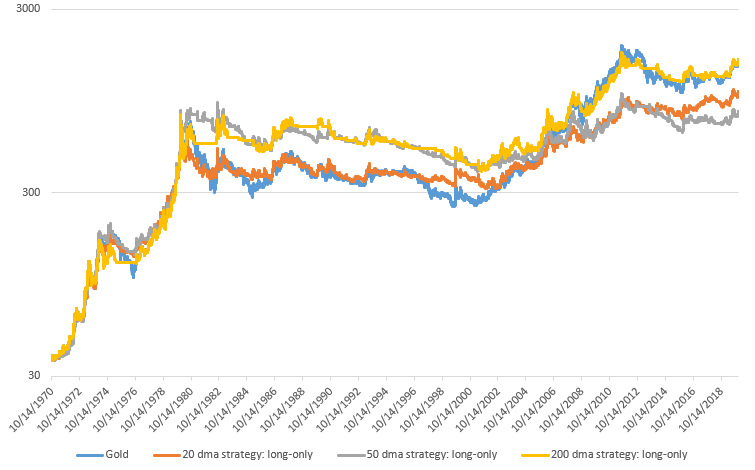
Here's what happens when you:
- Long-only strategy: only buy when the market is above its 20 sma, 50 sma, or 200 sma
- Short-only strategy: only short when the market is below its 20 sma, 50 sma, or 200 sma
Long only:
Short only:
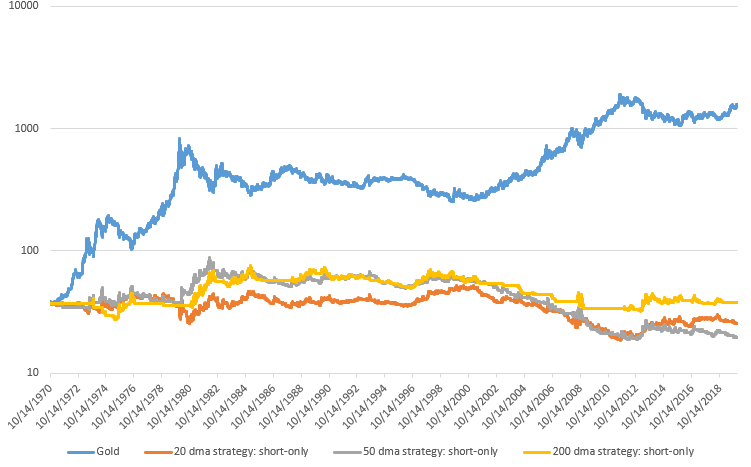
For the U.S. Dollar Index
Here's what happens when you:
- Long-only strategy: only buy when the market is above its 20 sma, 50 sma, or 200 sma
- Short-only strategy: only short when the market is below its 20 sma, 50 sma, or 200 sma
Long only:
Short only:
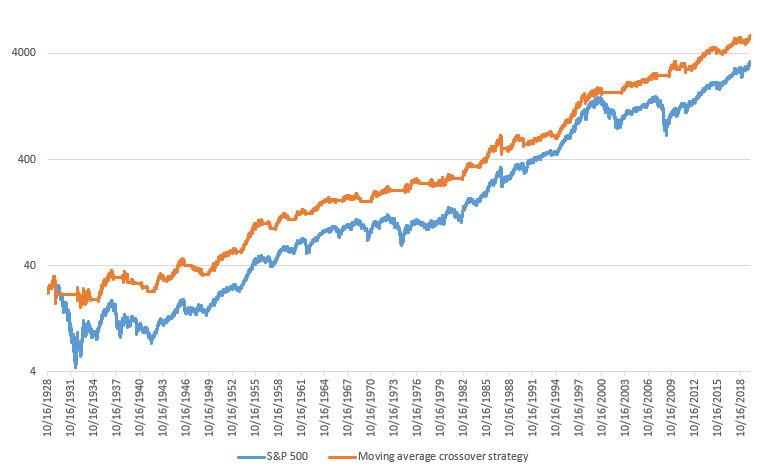
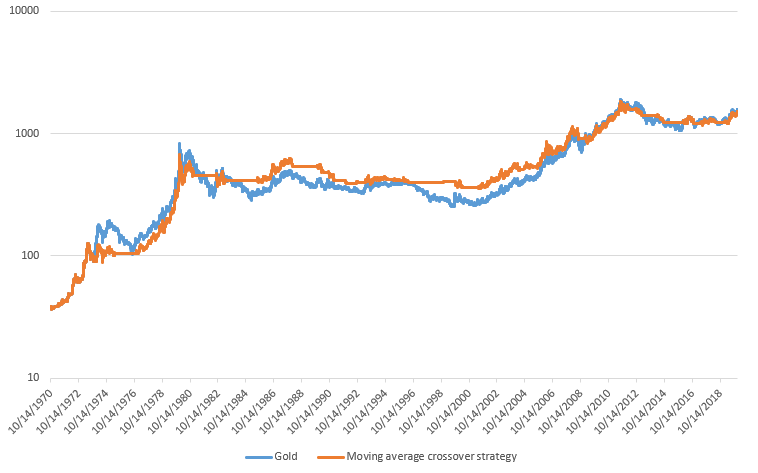
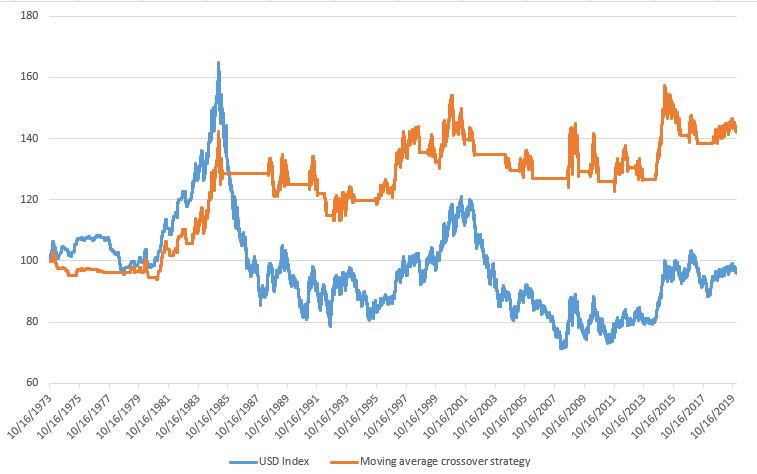
Data and facts for strategy #2: go long when the market forms a bullish crossover (50 sma crosses above 200 sma) and sell when the market forms a bearish crossover (50 sma crosses below the 200 sma)
For the S&P 500:
For gold:
For the U.S. Dollar:
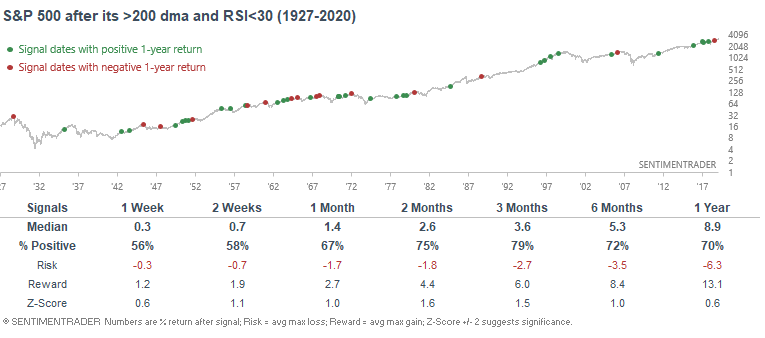
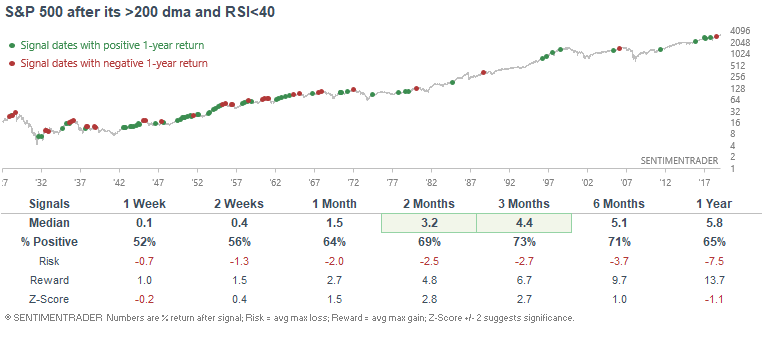
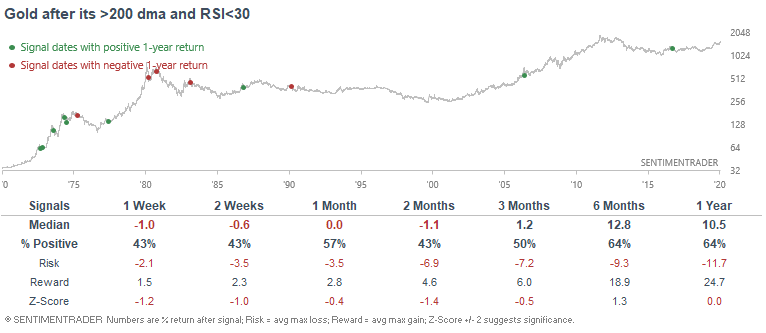
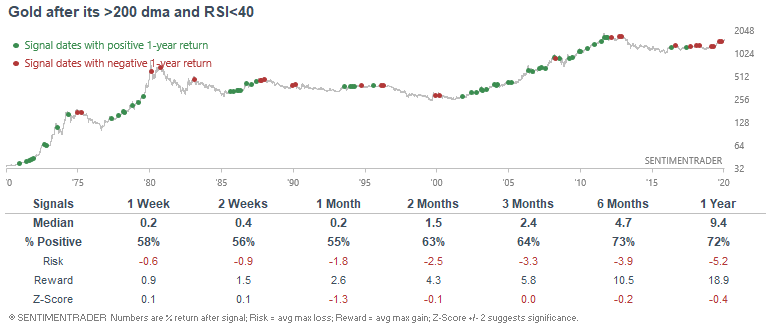
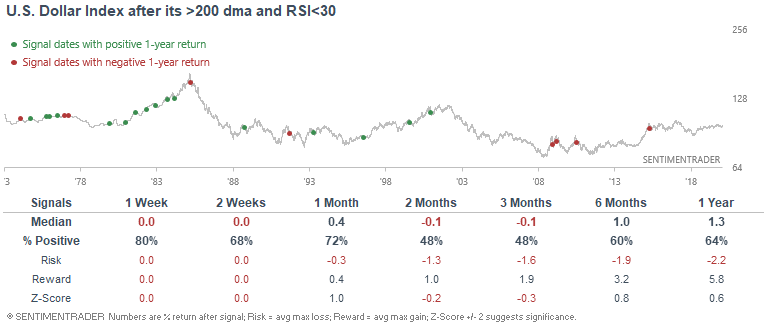
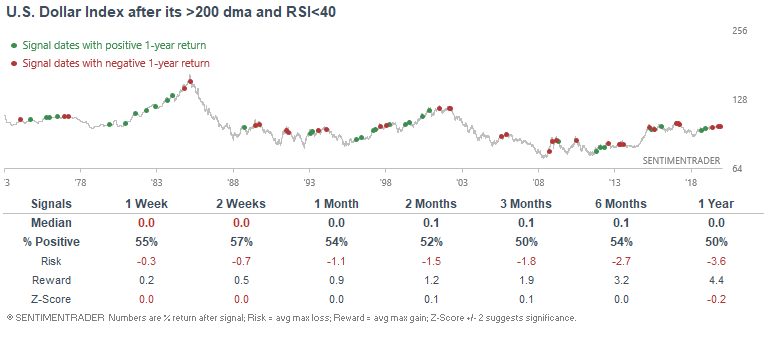
Data and facts for strategy #3: buy when the market is above its 200 dma, and 14 day RSI is low
For the S&P 500:
*48 historical cases:
*98 historical cases:
For gold:
*14 historical cases:
*86 historical cases:
For the U.S. Dollar Index:
*25 historical cases:
*65 historical cases:
Key Takeaway
Here are several key points that I hope you can takeaway from this ultimate guide for moving averages:
- As a trend following tool, moving averages work in markets that have clear, long term trends. They work better in markets that tend to go upwards over the long term (e.g. U.S. stock market)
- Moving averages don't work that well in markets that can be very choppy for long periods of time.
- Moral of the story: moving averages are not a one-size-fits-all holy grail.
- The concept of "trade on the side of the market's trend" works best in markets that have clear UP and DOWN long term trends, such as the U.S. stock market. It doesn't work that well in markets that can chop sideways for many years.
In future posts we will look at what is the optimal moving average for each market, and are exponential moving averages more effective than simple moving averages.
What is the best moving average for various markets?
A lot of traders wonder “what’s the best moving average? Should I use the 26 ema? The 200 sma? The 50 sma?”
As usual, these kinds of questions bring out a lot of responses from various traders, and everyone has their own opinion. Let’s put aside opinions, belief, and “ in my own experience” statements. Instead, let’s just look at the facts.
We’re going to test 3 different moving average strategies on 3 different markets. Using a bit of code, I’ll show you the optimal moving average settings based on historical performance.
- What’s the best simple moving average?
- What’s the best exponential moving average?
- What’s the best moving average crossover settings?
Strategy #1: go long when the market is above its X day simple moving average, otherwise SELL and shift into 100% cash
I’ll test every moving average from 2 to 300 (i.e. 2 day simple moving average, 3 day simple moving average, 4 day simple moving average….) and see which moving average provides the best historical performance.
I’ll test each of these moving averages on the S&P 500, gold, and the U.S. Dollar Index.
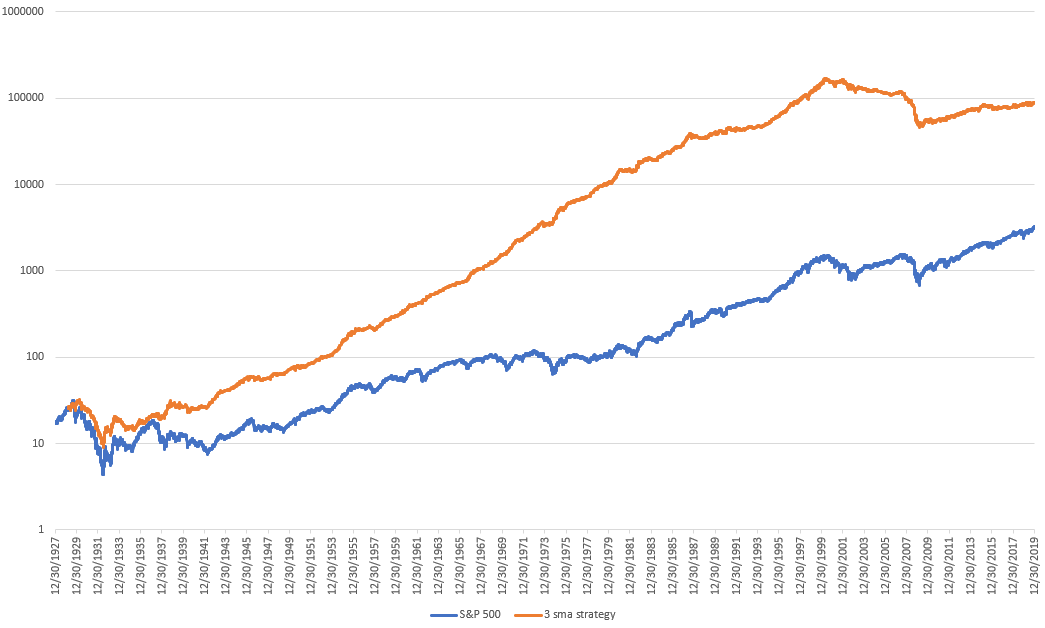
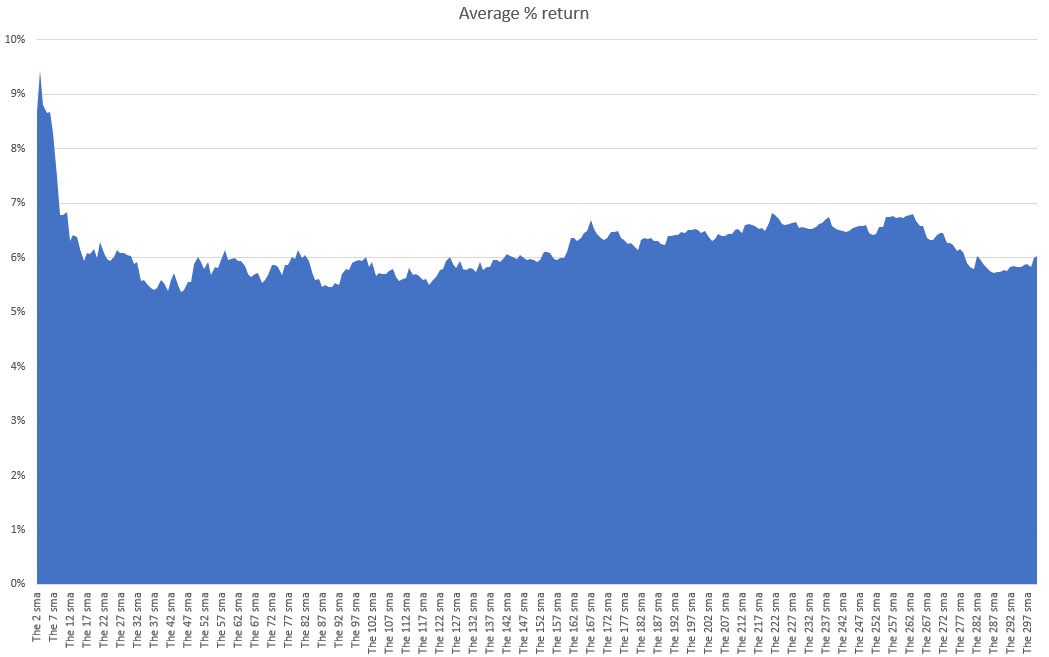
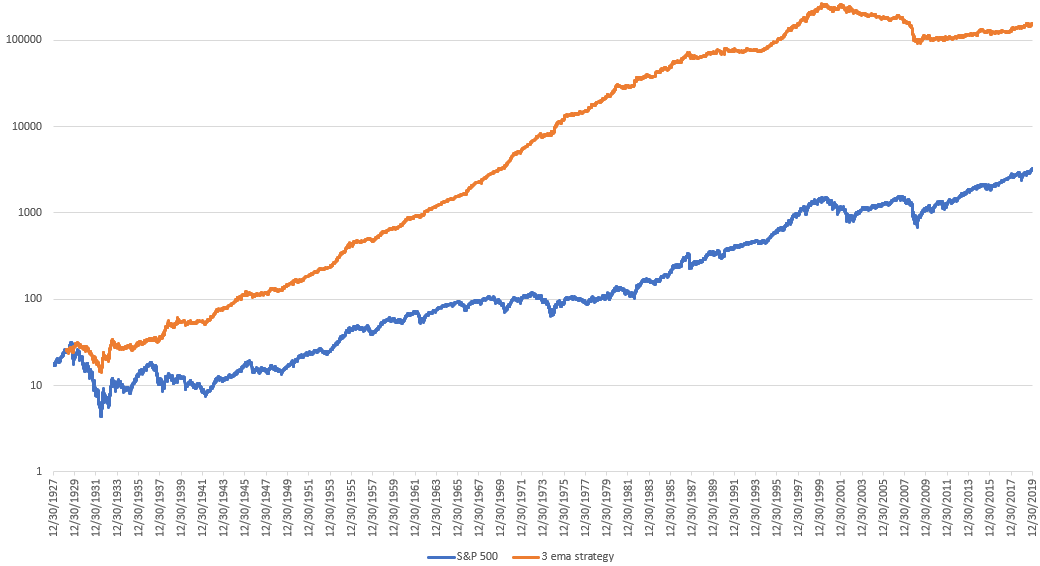
For the S&P 500 (1928-2019): the optimal simple moving average was the 3 day simple moving average, which yielded an average of 9.43% per year vs. buy and hold’s 5.48% per year (this does not include dividends reinvested).
The following chart demonstrates every simple moving average and its % annual return:
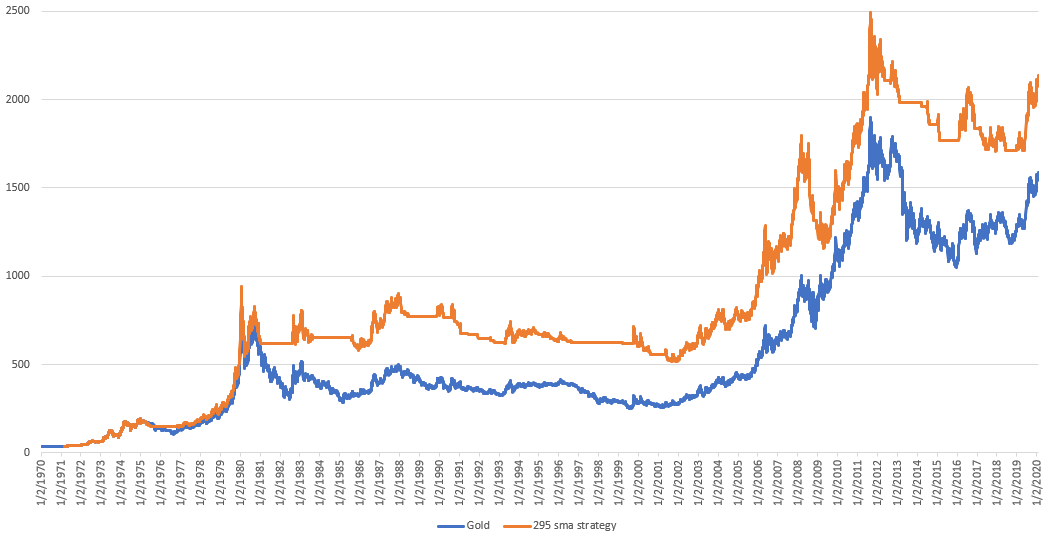
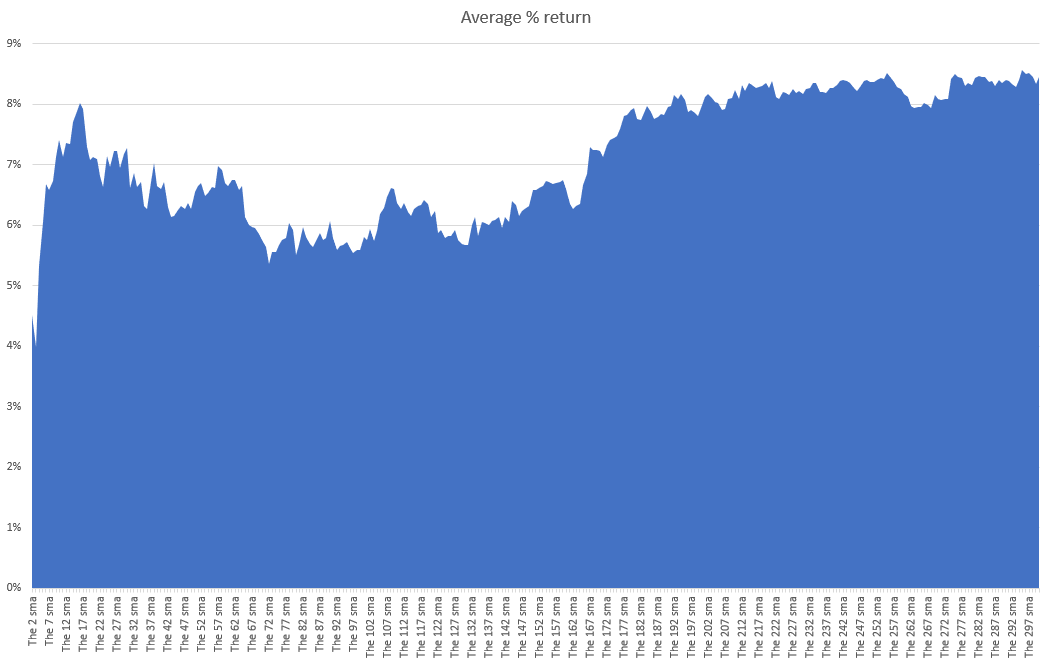
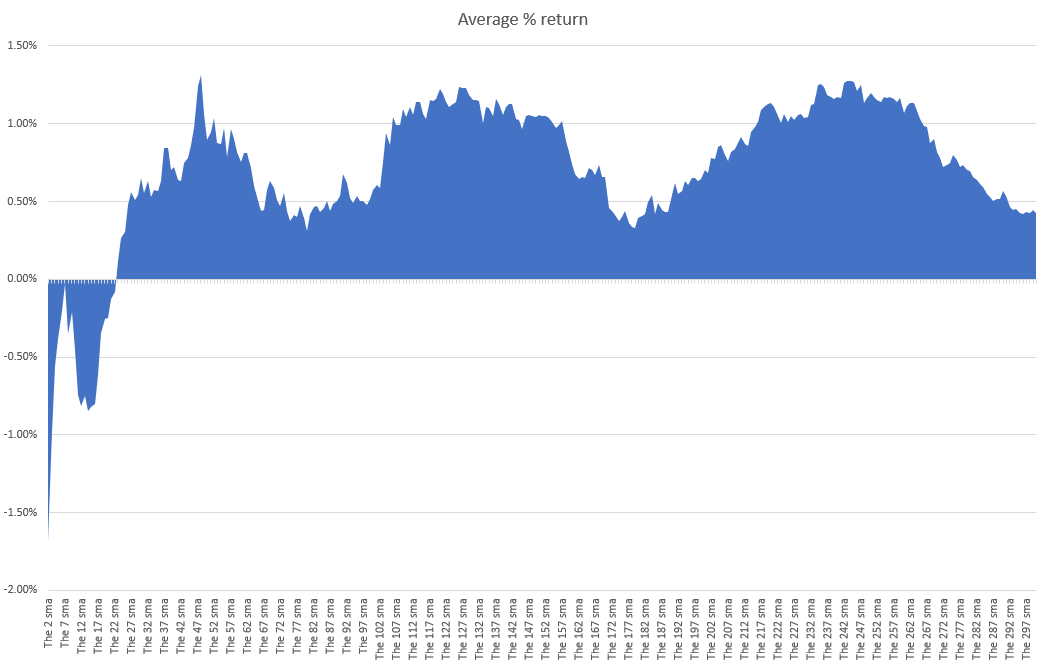
For gold (1970-2019): the optimal simple moving average was the 295 day simple moving average, which yielded an average of 8.56% per year vs. buy and hold’s 7.9% per year.
The following chart demonstrates every simple moving average and its % annual return:
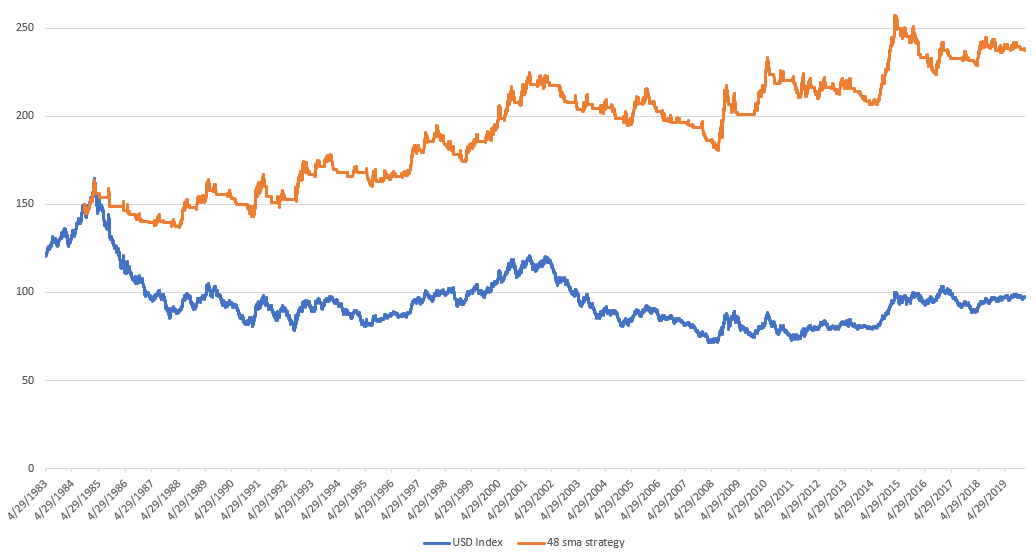
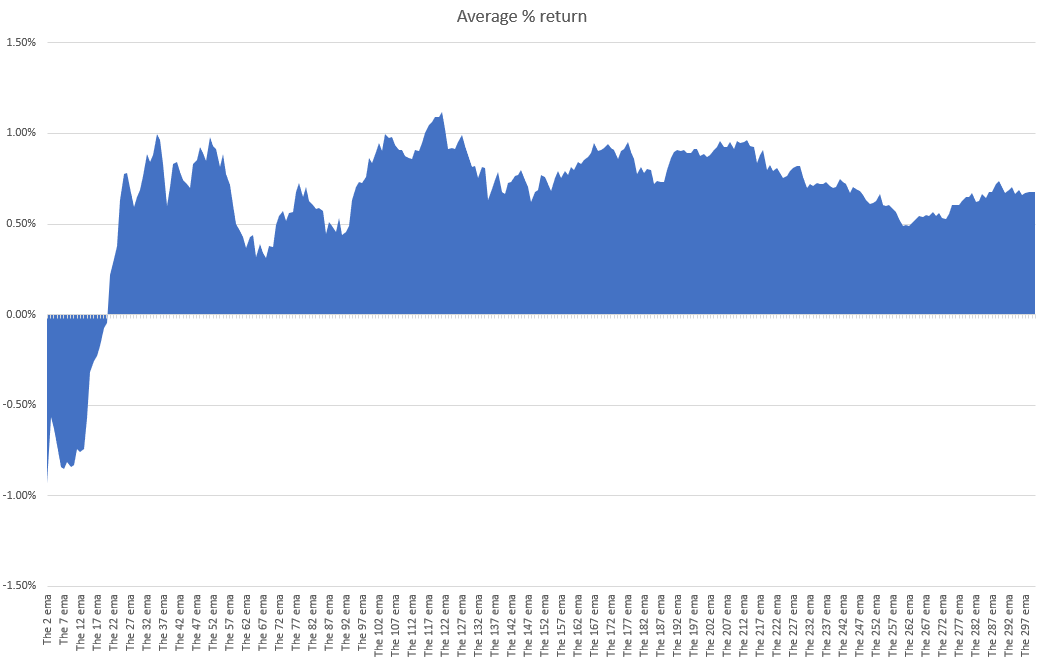
For the U.S. Dollar Index (1983-2019): the optimal simple moving average was the 48 day simple moving average, which yielded an average of 1.31% per year vs. buy and hold’s -1.21% per year.
The following chart demonstrates every simple moving average and its % annual return:
Strategy #2: go long when the market is above its X day exponential moving average, otherwise SELL and shift into 100% cash
I’ll test every moving average from 2 to 300 (i.e. 2 day exponential moving average, 3 day exponential moving average, 4 day exponential moving average….) and see which moving average provides the best historical performance.
I’ll test each of these moving averages on the S&P 500, gold, and the U.S. Dollar Index.
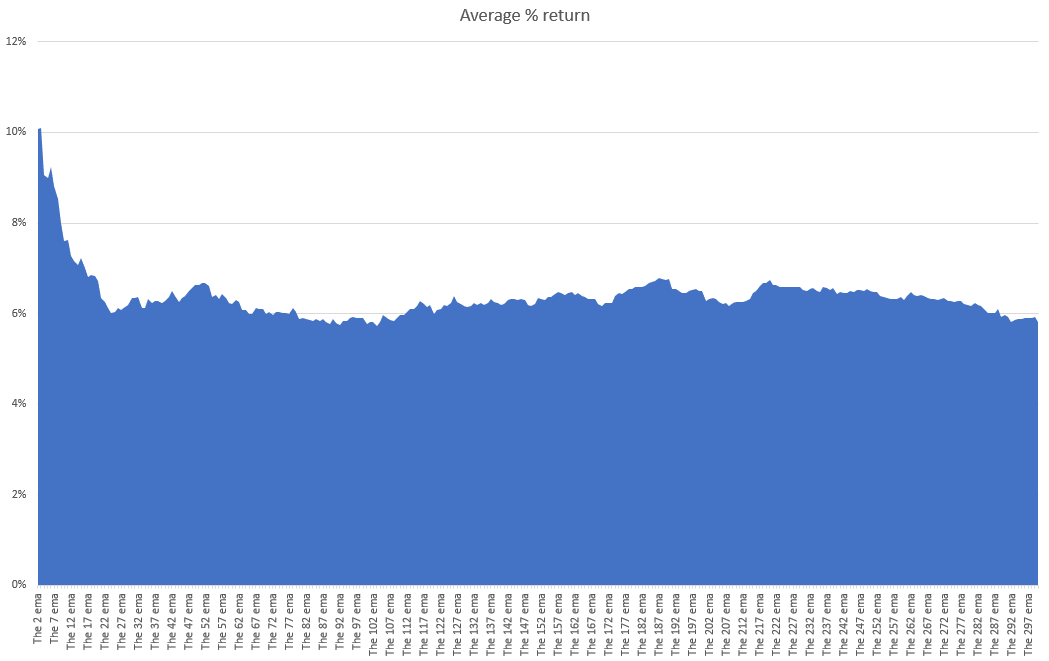
For the S&P 500 (1928-2019): the optimal exponential moving average was the 3 day exponential moving average, which yielded an average of 10.1% per year vs. buy and hold’s 5.48% per year (this does not include dividends reinvested).
The following chart demonstrates every exponential moving average and its % annual return:
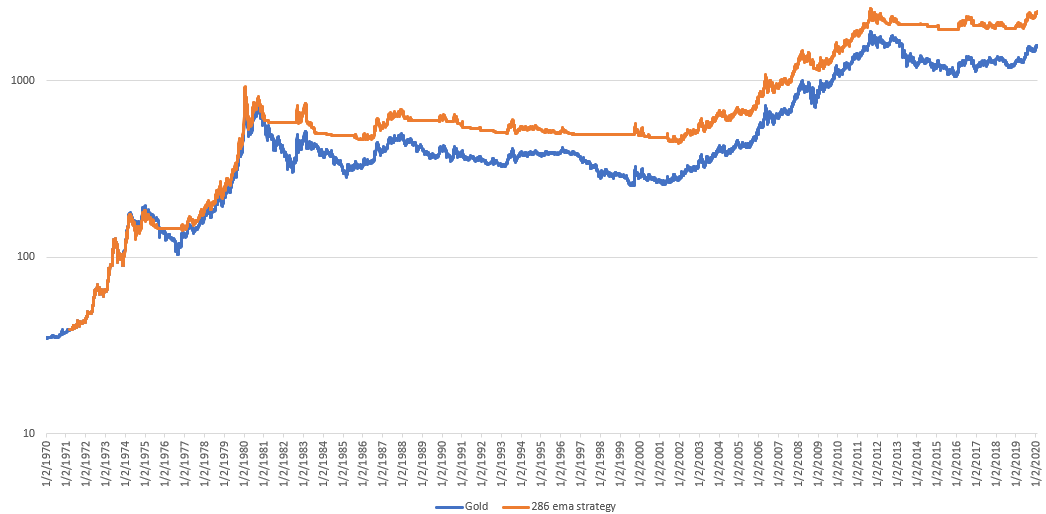
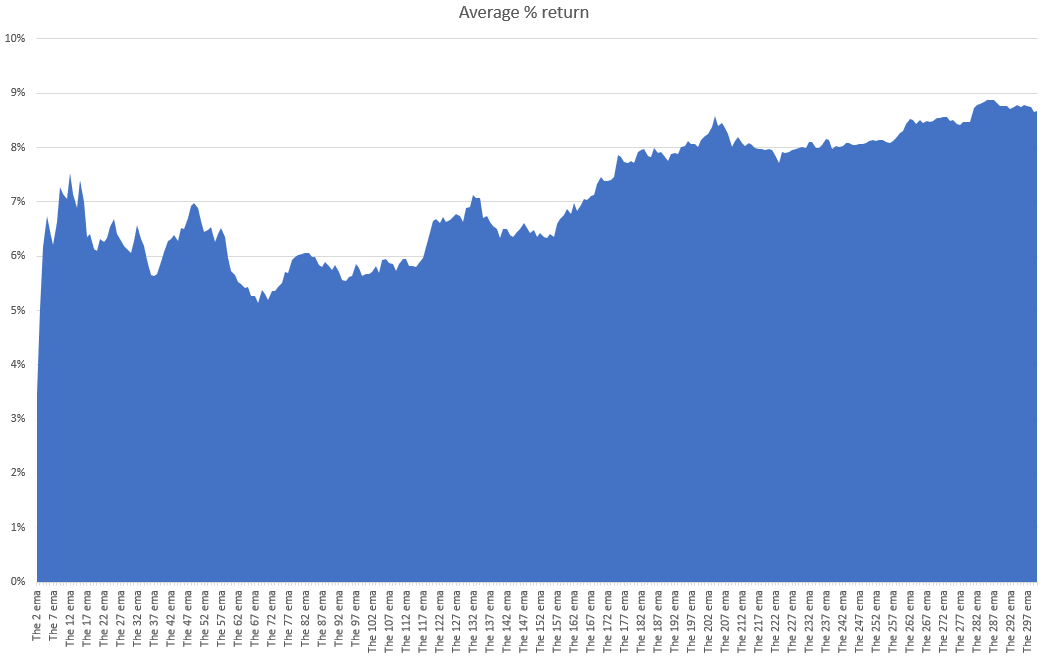
For gold (1928-2019): the optimal exponential moving average was the 286 day exponential moving average, which yielded an average of 8.88% per year vs. buy and hold’s 7.9% per year.
The following chart demonstrates every exponential moving average and its % annual return:
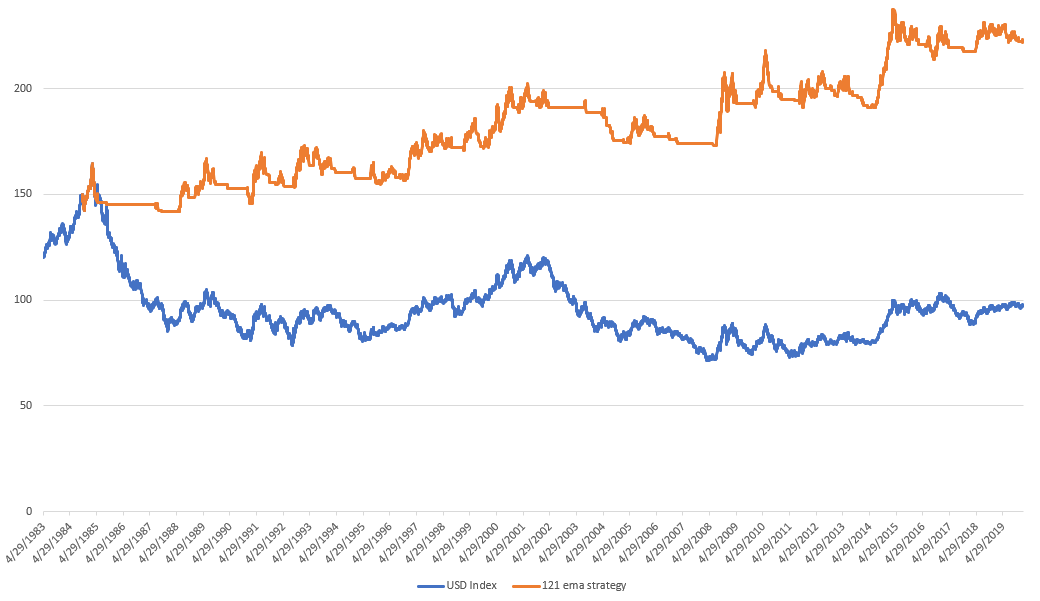
For the U.S. Dollar Index (1928-2019): the optimal exponential moving average was the 121 day exponential moving average, which yielded an average of 1.11% per year vs. buy and hold’s -1.21% per year.
The following chart demonstrates every exponential moving average and its % annual return:
Strategy #3: go long when the market’s X day simple moving average crosses above its Y day simple moving average, and SELL when the market’s X day simple moving average crosses below its Y day simple moving average.
I’ll test every combination of moving averages from 2 to 300. I’ll test the 2 sma and 3 sma crossover, the 10 sma and 20 sma crossover, the 50 and 200 sma crossover, the 104 and 259 sma crossover, etc. In total, this code will test tens of thousands of moving average crossover pairs for each market.
I’ll test each of these moving average crossover pairs on the S&P 500, gold, and the U.S. Dollar Index.
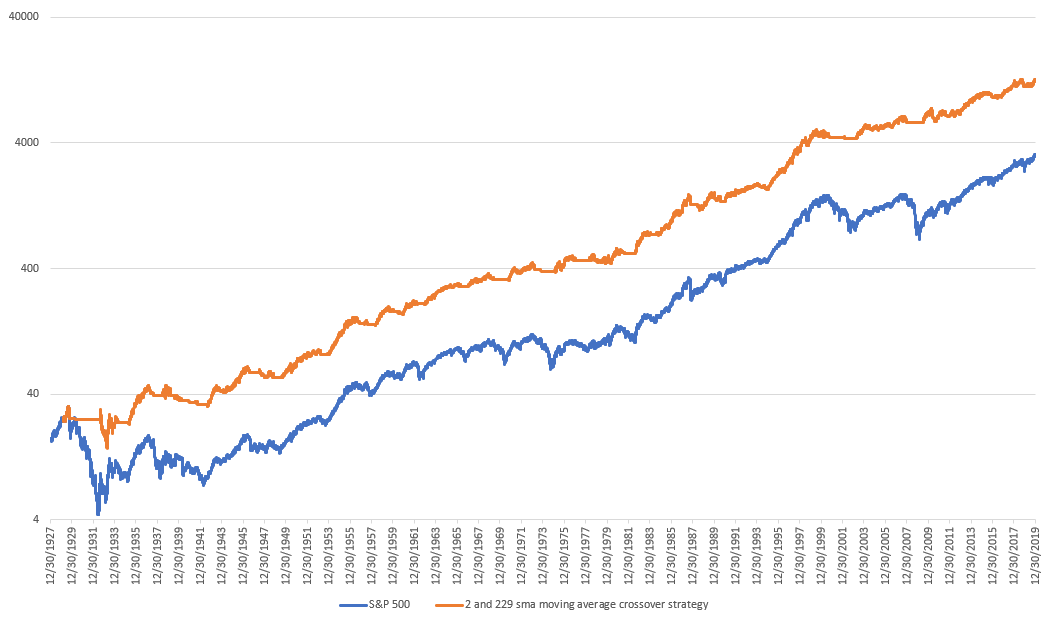
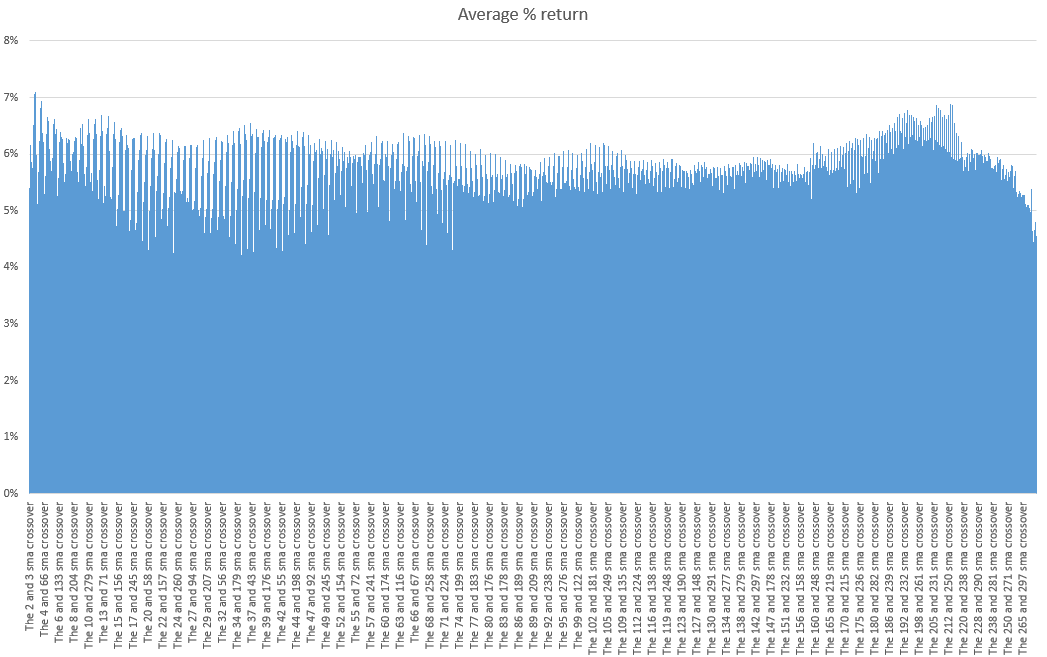
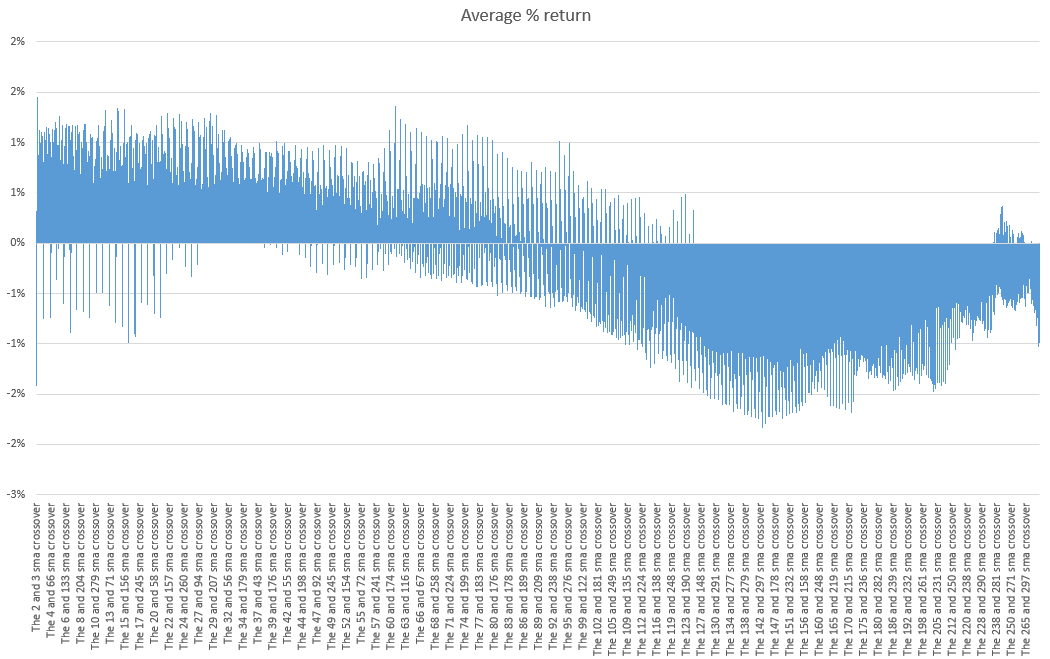
For the S&P 500 (1928-2019): the optimal moving average crossover pairs were the 2 day and 229 day simple moving averages, which yielded an average of 7.09% per year vs. buy and hold’s 5.48% per year (this does not include dividends reinvested).
The following chart illustrates every moving average crossover pair and its annual % return:
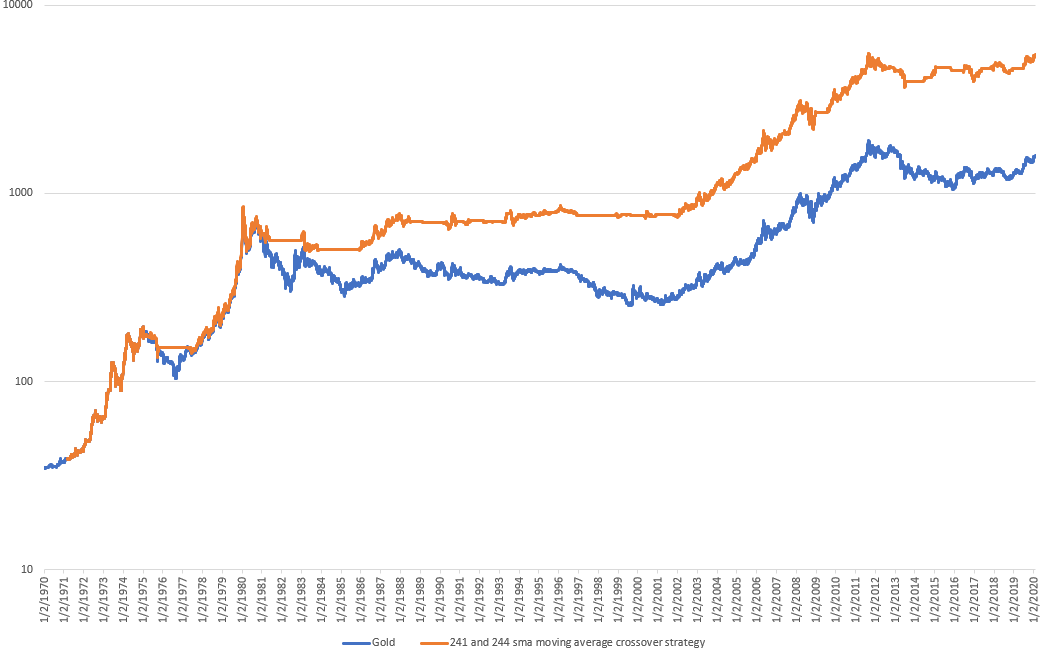
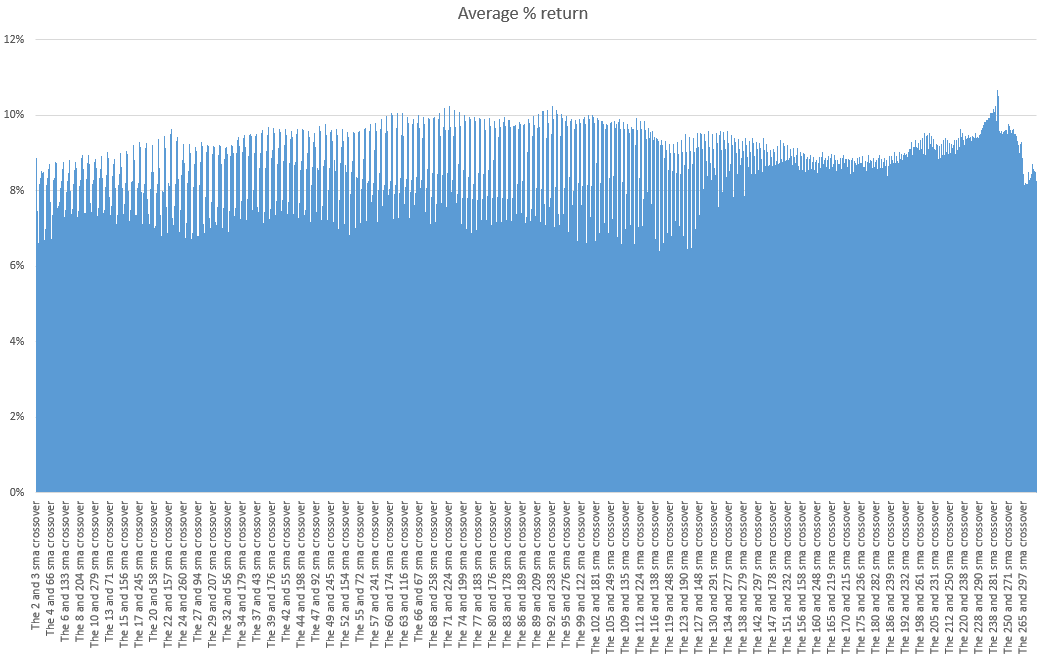
For gold (1970-2019): the optimal moving average crossover pairs were the 241 day and 244 day simple moving averages, which yielded an average of 10.67% per year vs. buy and hold’s 7.9% per year.
The following chart illustrates every moving average crossover pair and its annual % return:
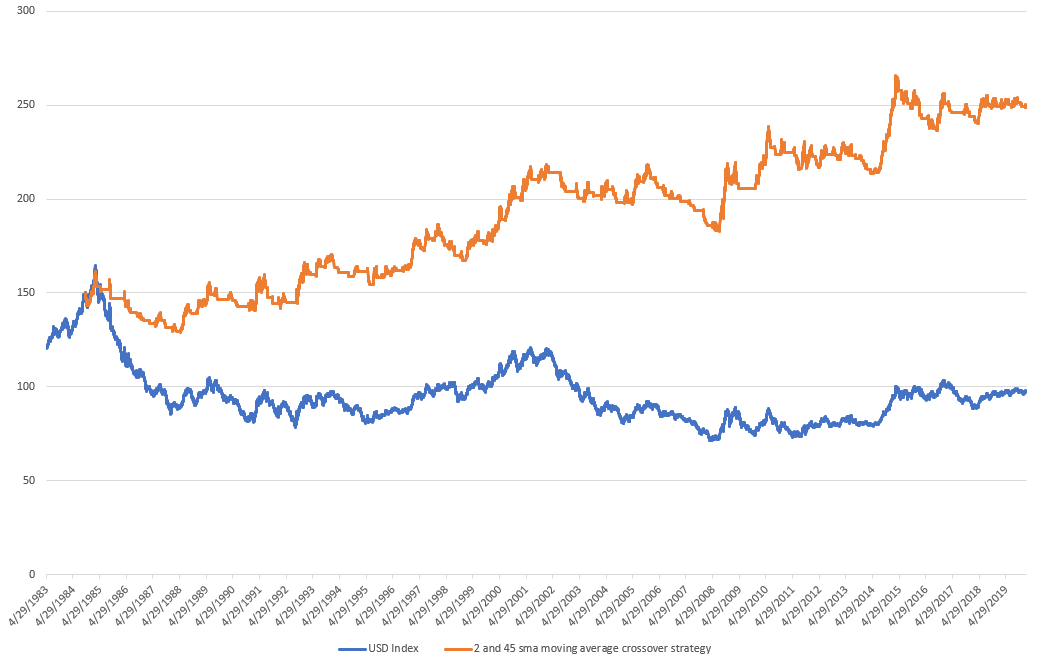
For the U.S. Dollar Index (1983-2019): the optimal moving average crossover pairs were the 2 day and 45 day simple moving averages, which yielded an average of 1.44% per year vs. buy and hold’s -1.21% per year.
The following chart illustrates every moving average crossover pair and its annual % return:
Conclusion for moving average optimization
There is a “best” moving average, at least historically. There’s no need to guess which moving average is best.
With that being said, I caution traders against spending too much time playing around with their moving average settings because:
- The difference between a good setting and a bad setting isn’t massive, and more importantly…
- The best moving average setting in the past might not be the best moving average setting in the future. What worked in the past may suddenly (and without warning) stop working in the future.
- What made a moving average work better than another moving average in the past is probably just due to random luck (i.e. there's no solid reason why one should work better than another).
And finally, moving averages ARE NOT a holy grail. That's why the best moving average differs significantly from market to market.
*As an important sidenote, these returns do not include transaction costs or slippage. After doing so, a 3 day sma might not come out ahead vs. a e.g. 50 day sma which includes fewer transactions.

