Moving Average Trend Count Signal Concept

On Tuesday, I shared the outlook for crude oil after the commodity traded above its 10-day moving average for 21 consecutive days. The successive days above or below a moving average calculation is not a new concept. I've seen Jason and other analysts reference the measure in countless research studies. Given that I'm a big fan of the indicator, one should not be surprised to learn that I created a signal based on the concept.
I've spent a tremendous amount of time studying market tops and bottoms over the years. So when I started down the road to identify a buy signal for the consecutive days above the moving average indicator, I noticed a unique pattern around significant lows. A high level of successive days below a moving average is subsequently followed by many days above the average. In simple terms, you have an oversold condition followed by a market thrust whereby the security remains above the moving average for an extended period. My research found that a simple 10-day moving average works the best.
SIGNAL CRITERIA FOR S&P 500
- Price < 10-day moving average for 12 days. i.e. oversold reset
- Price > 10-day moving average for 21 days. i.e., momentum thrust
The moving average trend count model is a component in the TCTM Composite Confirmation Model. Please click on the following link for the TCTM live page on the website. Click here.
Let's take a look at several historical charts and signal performance.
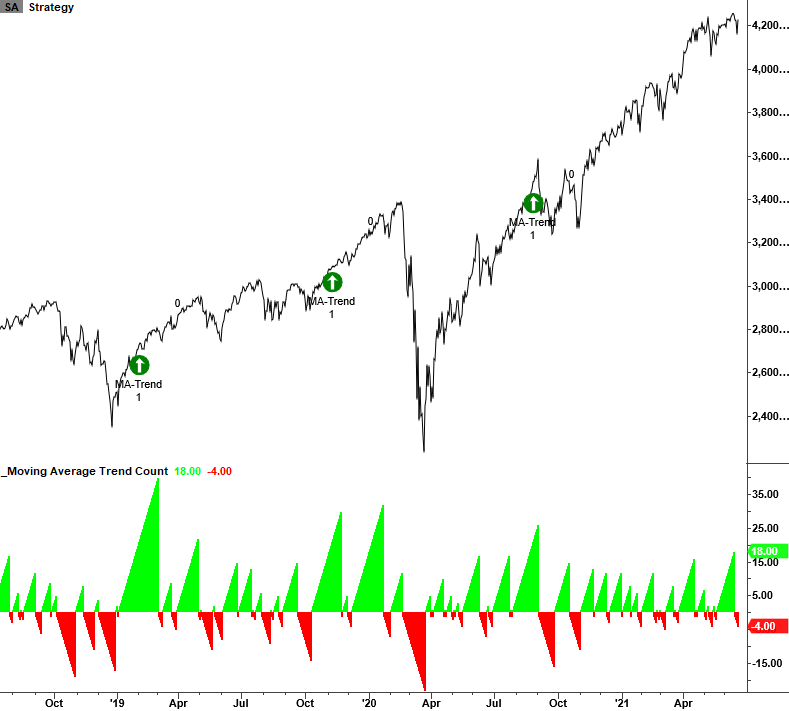
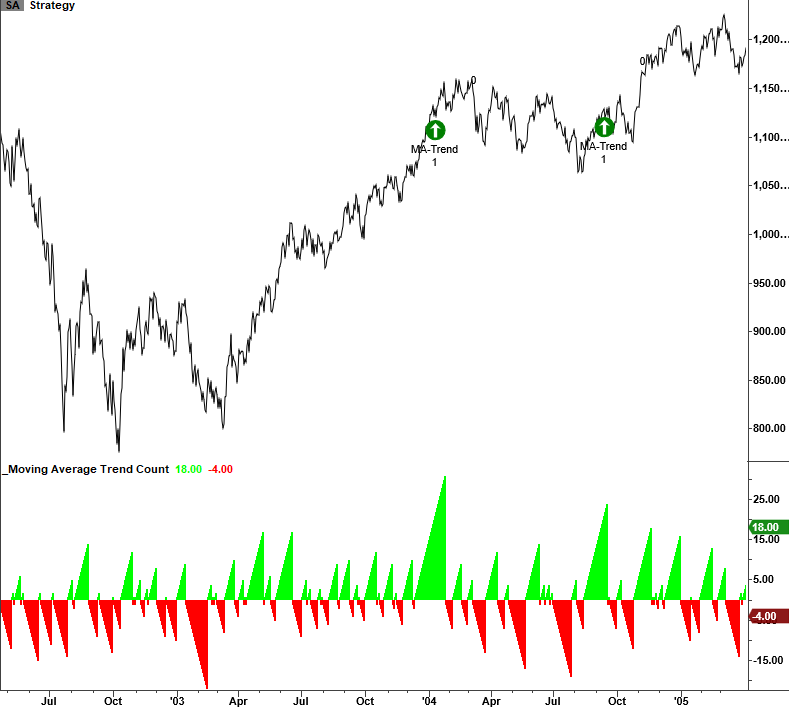
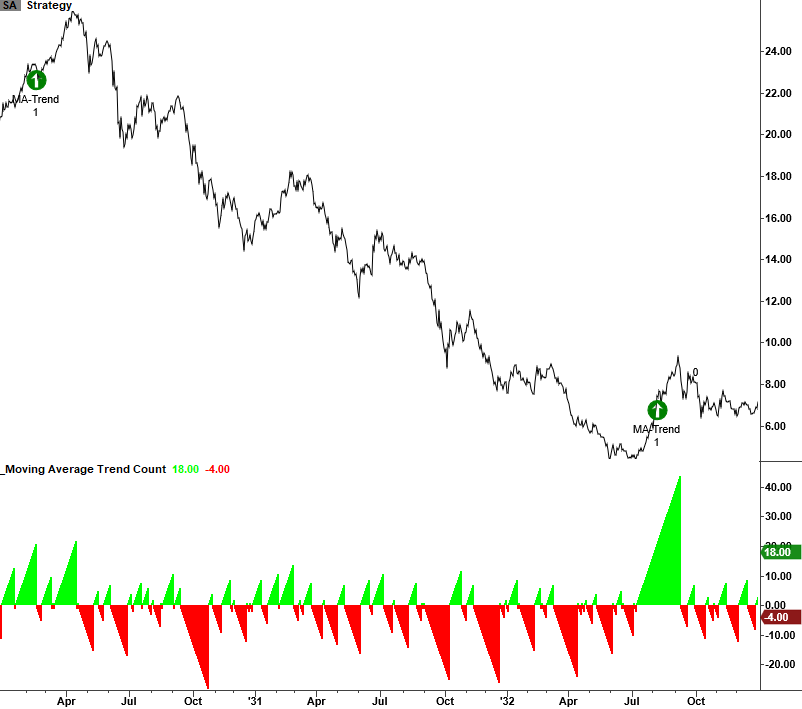
CURRENT DAY CHART
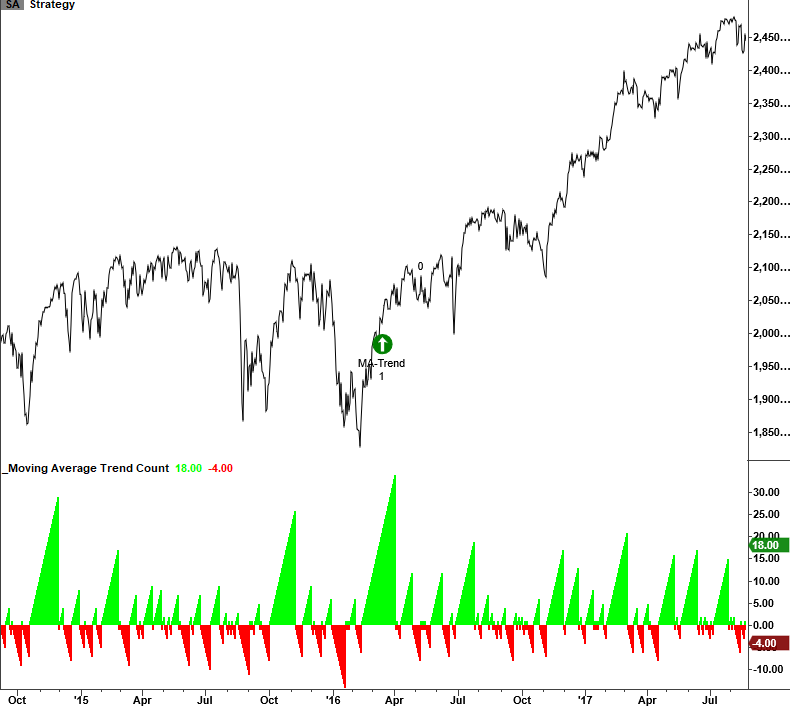
2015-2016 CORRECTION
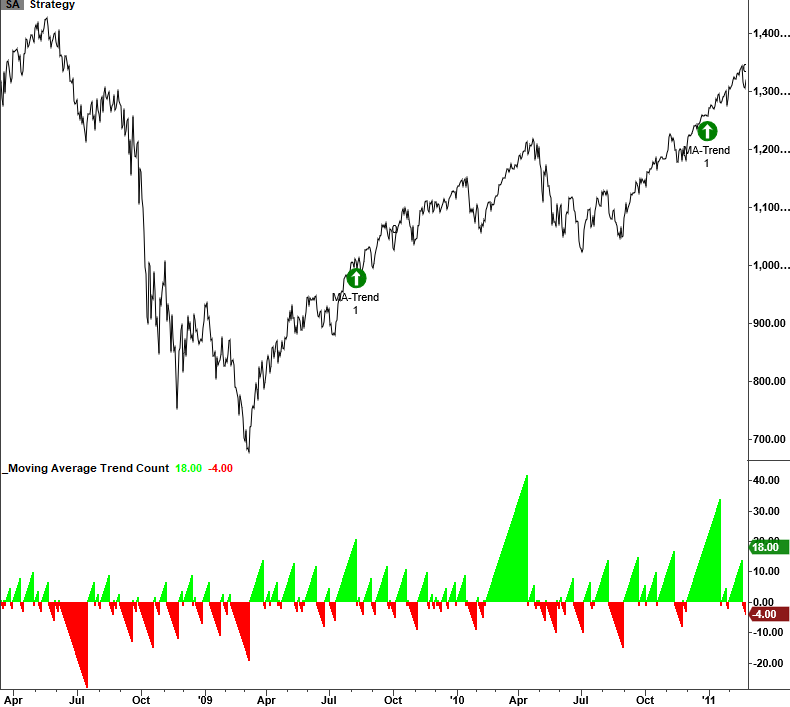
2007-09 BEAR MARKET
2000-02 BEAR MARKET
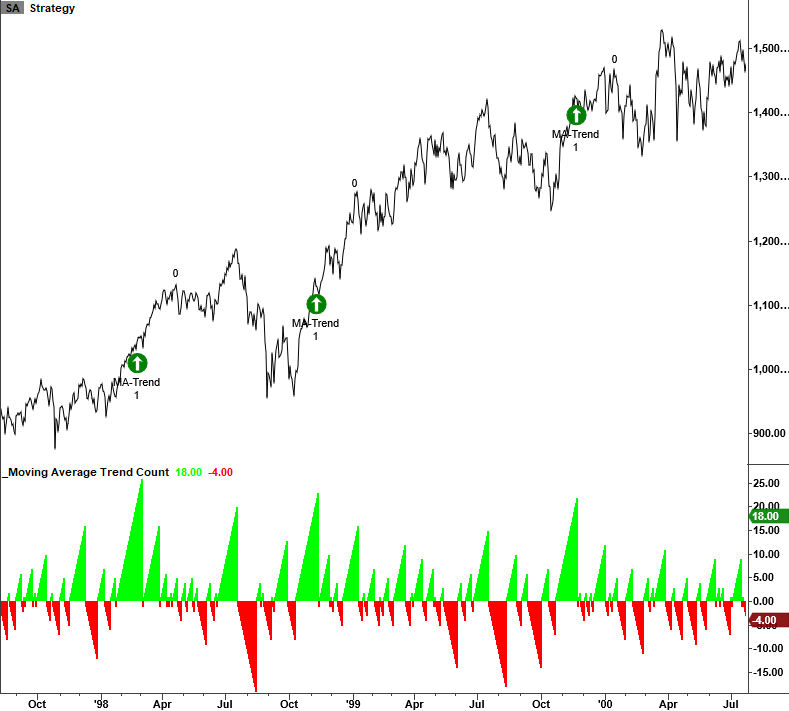
1998 CORRECTION
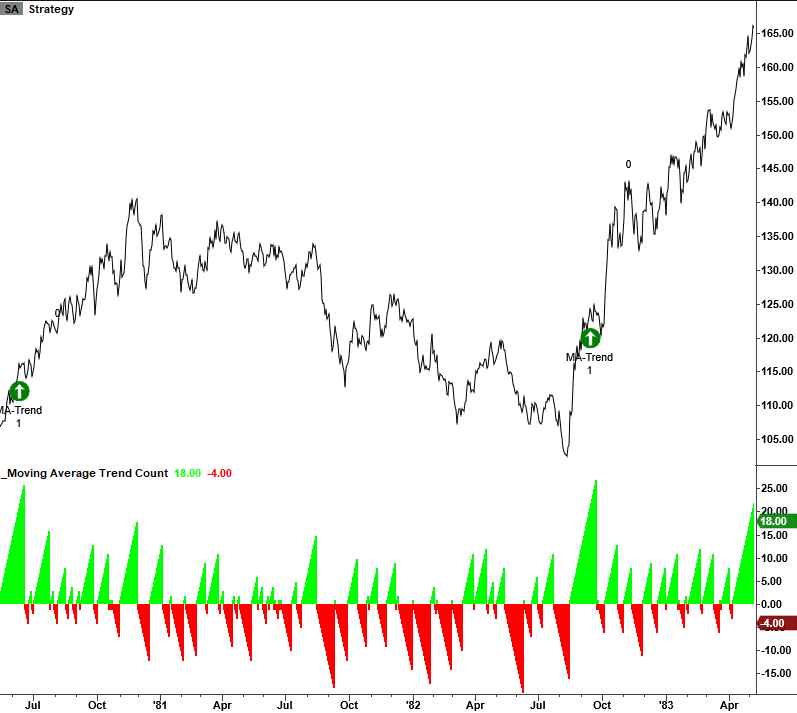
1980-82 BEAR MARKET
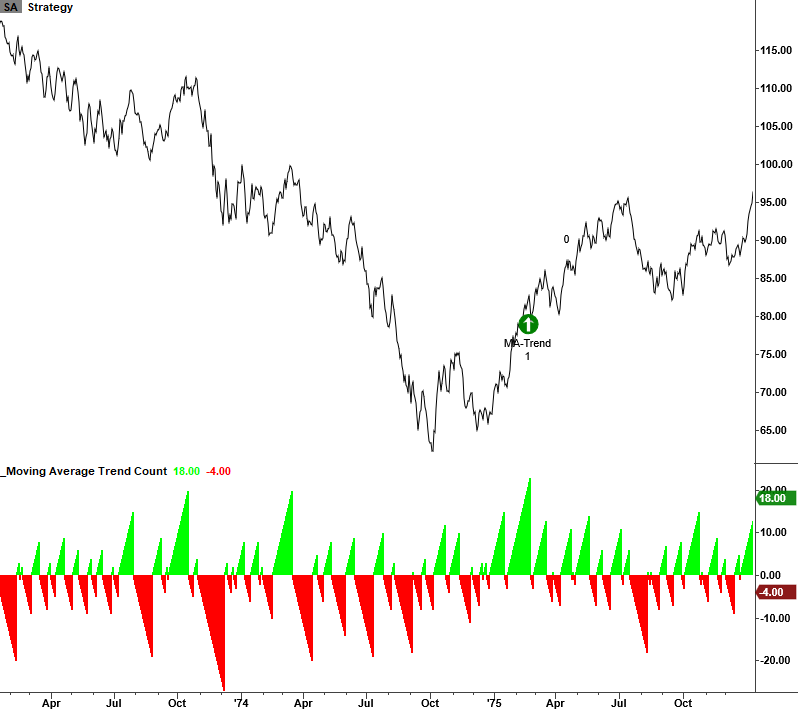
1973-74 BEAR MARKET
1929-32 BEAR MARKET
TRADING STATISTICS
The trading statistics in the table below reflect the optimal days-in-trade holding period of 39 days. When I run optimizations for trading signals, I cap the max number of days at 42.
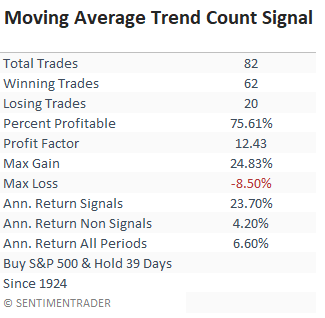
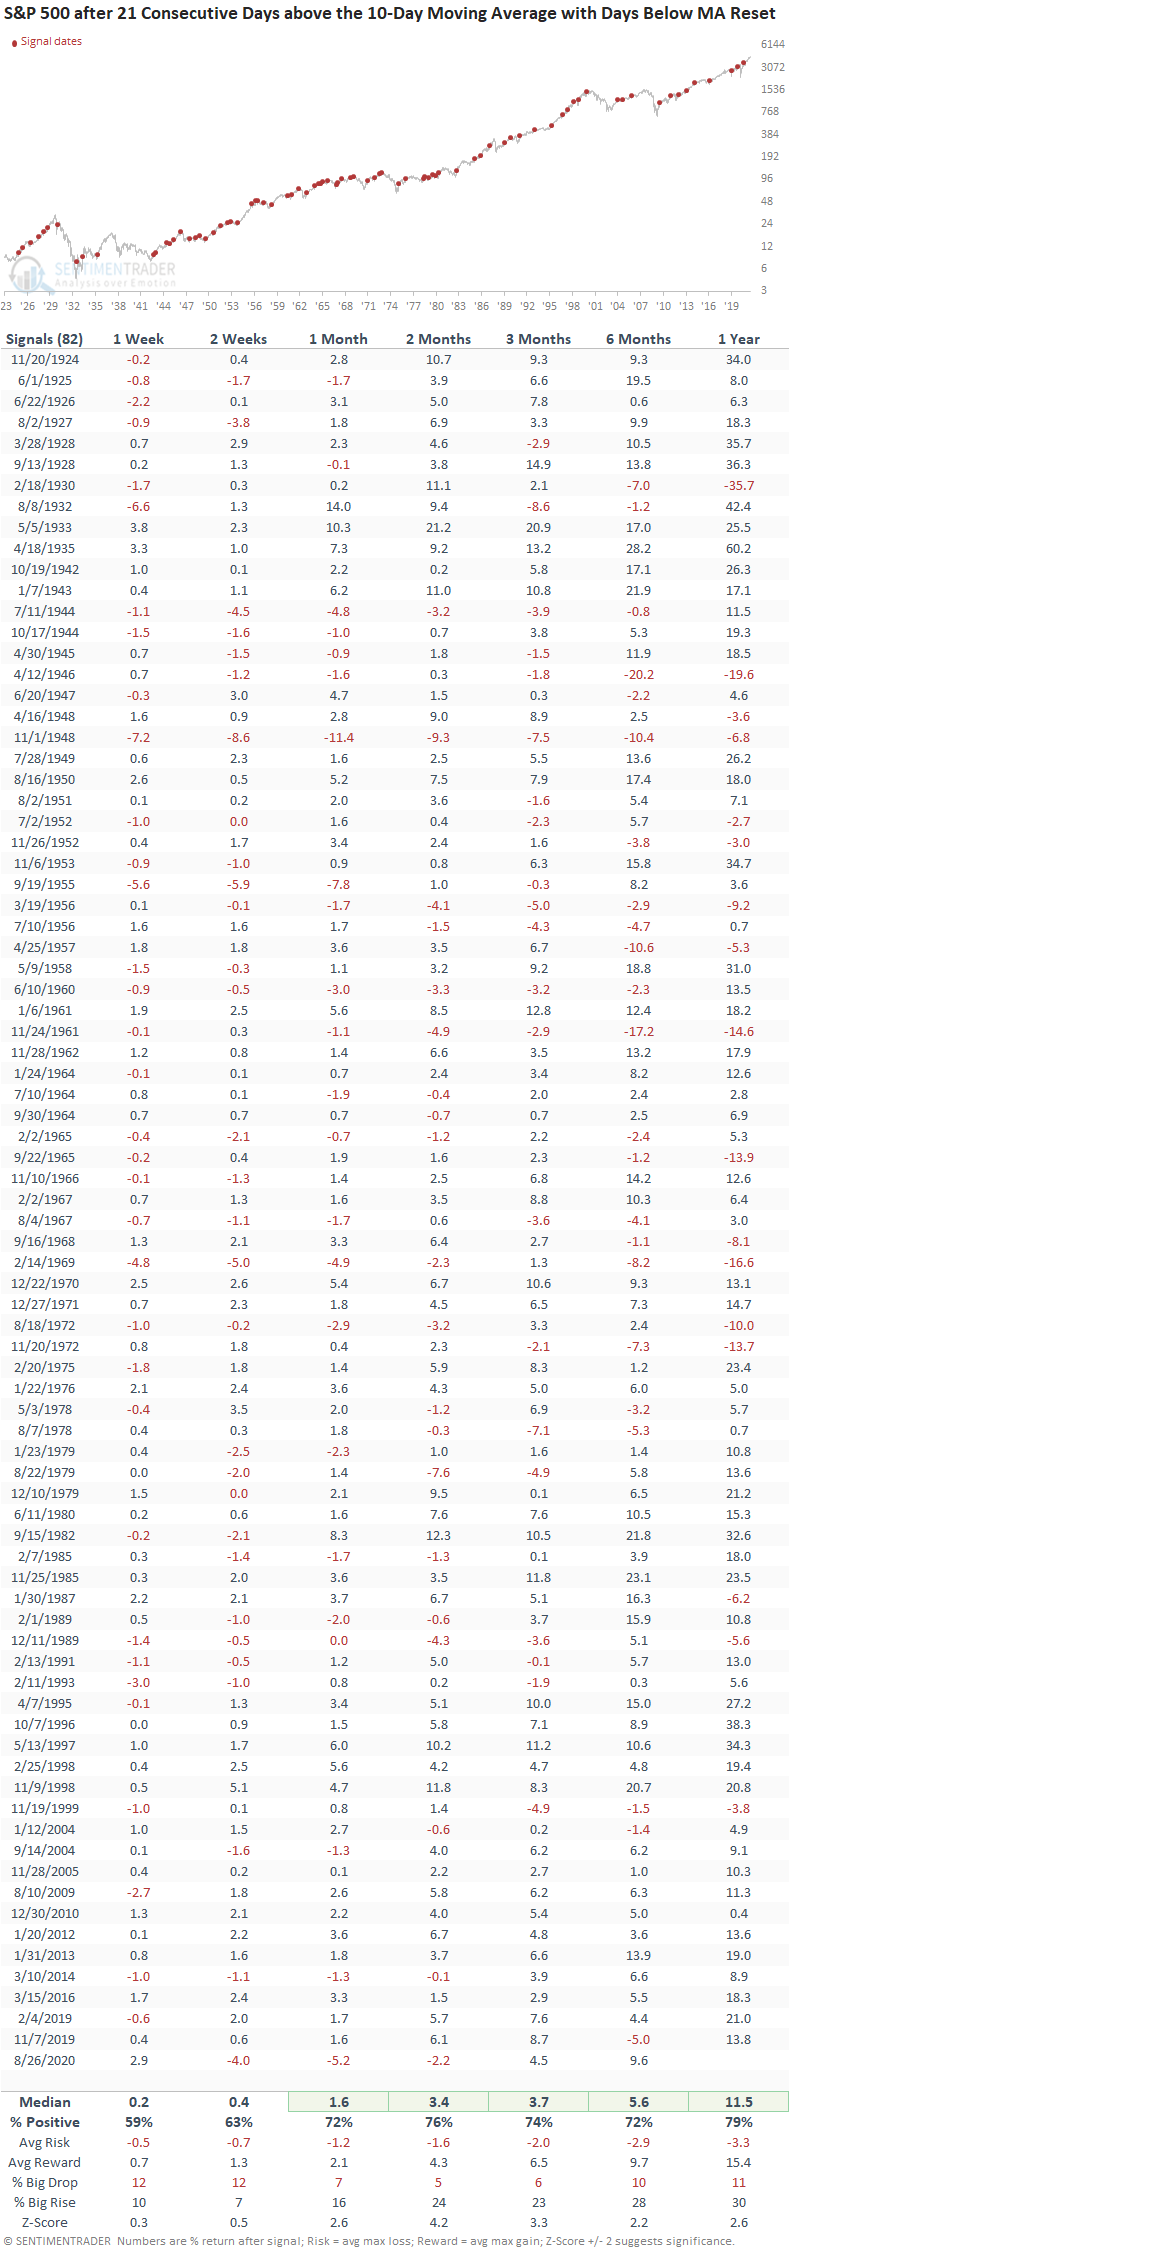
HOW THE SIGNALS PERFORMED
Results are slightly better in the short term and very solid on an intermediate to long-term basis with several notable z-scores. Remember, the strong results are after the S&P 500 has been in a short-term uptrend for a month.
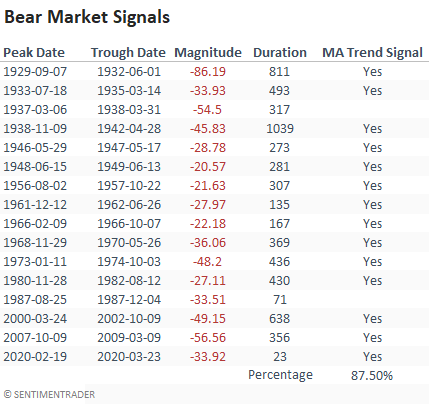
HISTORICAL PERSPECTIVE
The moving average trend count signal maintains an excellent record of identifying when the S&P 500 is transitioning out of a bear market with an 87.5% hit rate since 1932. However, because the signal can occur at a level well above the bear market low, I use the model in a composite. A weight-of-the-evidence approach is always preferred.
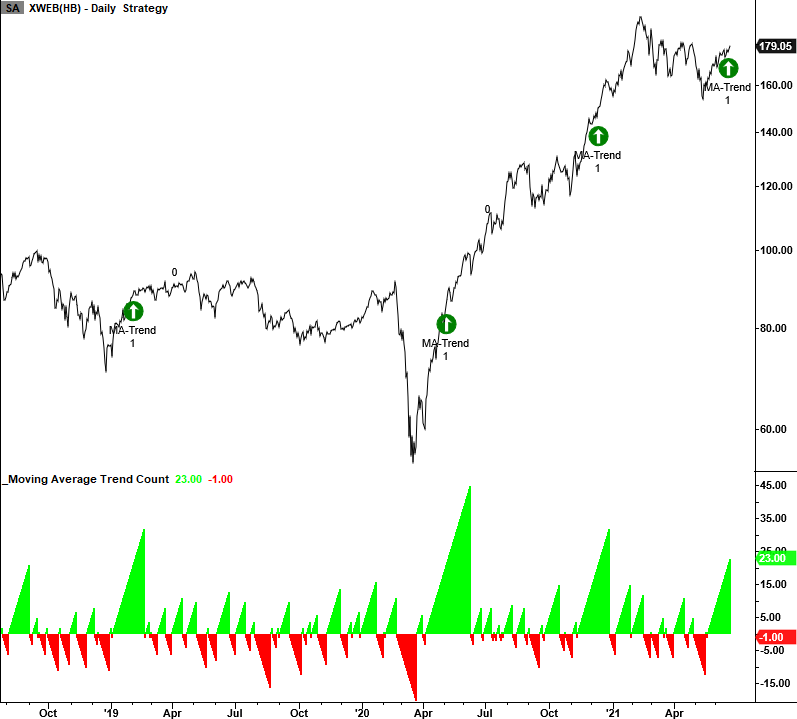
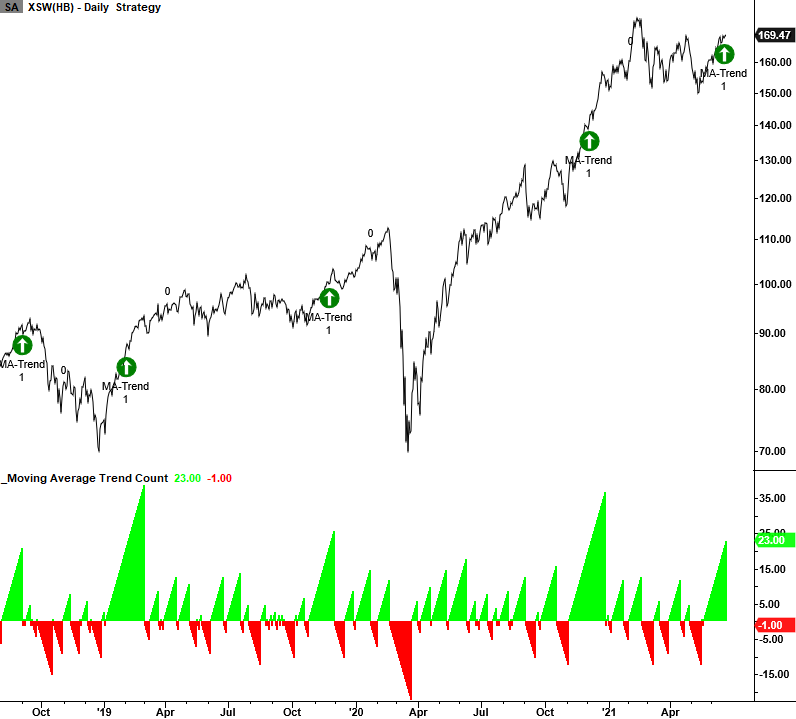
The concept can be applied to any security. The following growth-oriented ETFs fired a signal late last week.
S&P INTERNET ETF
S&P SOFTWARE AND SERVICES ETF
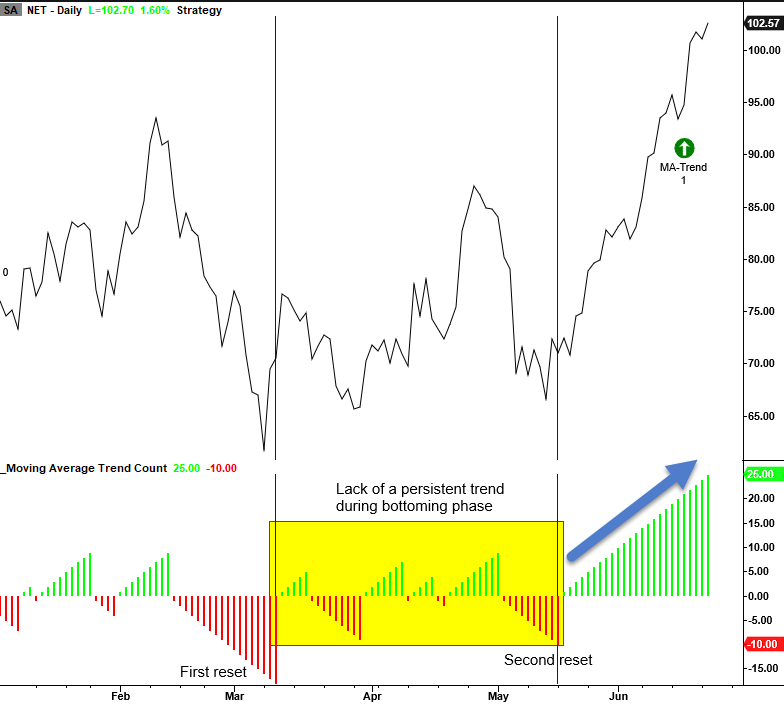
SINGLE STOCK SIGNALS - CLOUDFLARE (NET)
Cloudflare provides a textbook example of the moving average trend count process. After the initial correction that started in February, the stock chopped around in a consolidation whereby the moving average trend count could not increase above the user-defined threshold for a signal. In a bottoming process, high volatility creates an environment whereby price swings are inconsistent. Thus, when the security is ready for take-off, the stock should thrust upward in a persistent manner to move the count above the signal threshold.