Products
SentimenTrader Trading Tools
‍
Backtest Engine
My Trading Toolkit
Correlation Analysis
Seasonality
Market Prediction
Indicators & Data API
‍
Proprietary Indicators & Charts
Market Data API
Strategies & Scanner
‍
50+ Trading Strategies
Smart Stock Scanner
Smart Option Scanner
Research Reports
‍
Research Solutions
Reports Library
Free Resources
Simple Backtest Calculator
Simple Seasonality Calculator
The Kelly Criterion Calculator
Sentiment Geo Map
Public Research Reports
Education
Sentiment Indicators
Technical Indicators
Pricing
Company
About
In the News
Testimonials
Client Success Stories
Contact
Log inLoginSign up
< BACK TO ALL REPORTS

More thrust and reversal signals in Technology

Dean Christians
2023-11-13
The Nasdaq 100 and the S&P 500 Technology sector triggered new buy signals after internal and external price momentum shifted from bearish to bullish conditions. Similar precedents resulted in excellent outcomes for both indexes over short-, medium-, and long-term horizons.

Key points:

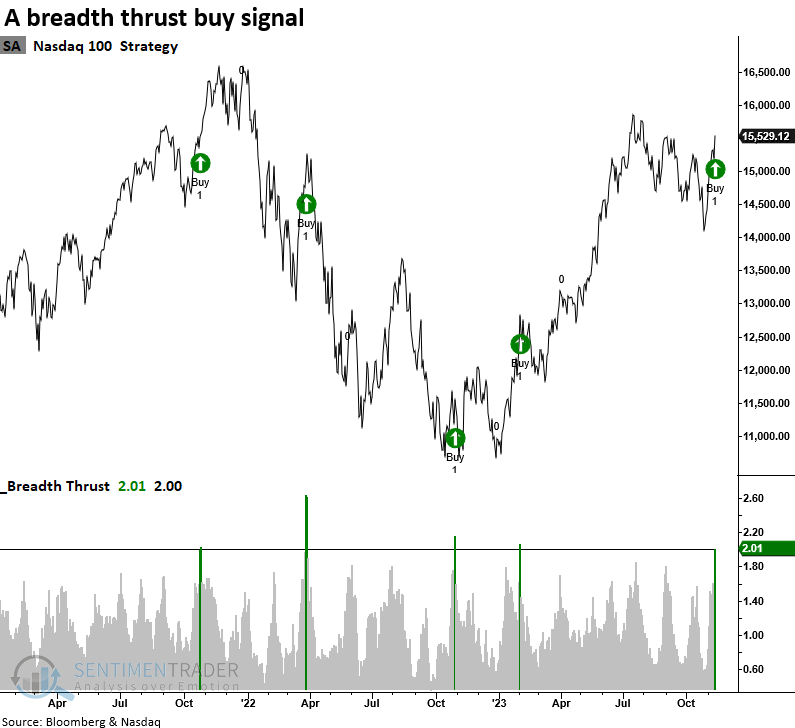
  • The Nasdaq 100 triggered a breadth thrust buy signal at the close of trading on Friday
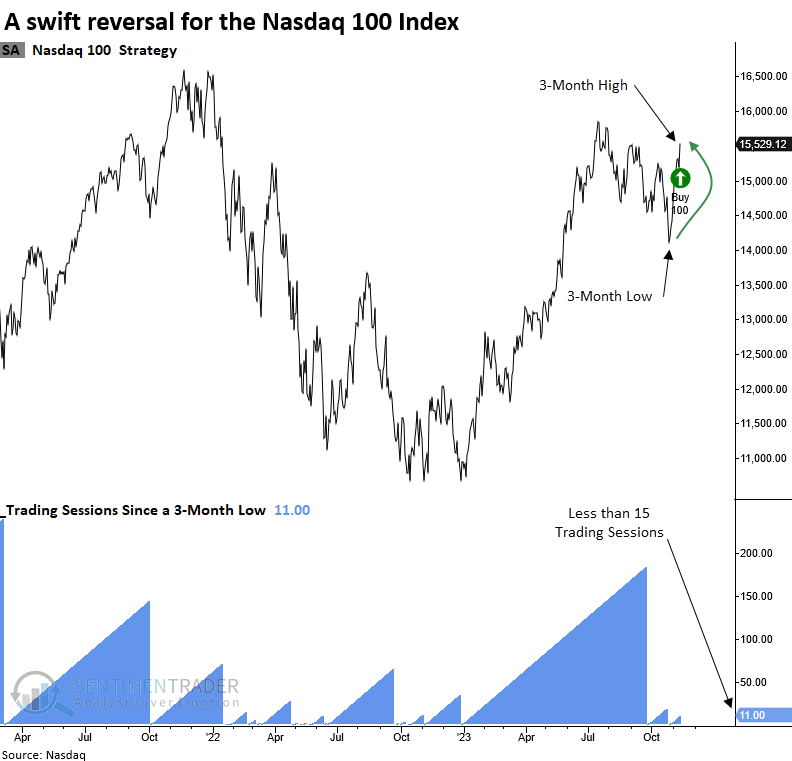
  • In less than 15 sessions, the S&P 500 Technology sector and the Nasdaq 100 cycled from a low to a high
  • Similar thrust and reversal signals displayed bullish outcomes for Technology and the Nasdaq 100

Additional bullish evidence for Technology-oriented stocks

In momentum investing, market participants monitor bullish price action in stocks or index ETFs with the premise that the trend will persist. Technology and Communication Services stocks undeniably exhibit bullish momentum. Therefore, as long as the evidence remains positive, traders should capitalize on what's working well and avoid less favorable areas.

At the close of trading on Friday, a breadth thrust buy signal triggered an alert for the technology-heavy Nasdaq 100. The thrust system I use was made famous by Walter Deemer, a revered market analyst. It's known as Breakaway Momentum (BAM).
More thrust and reversal signals in Technology

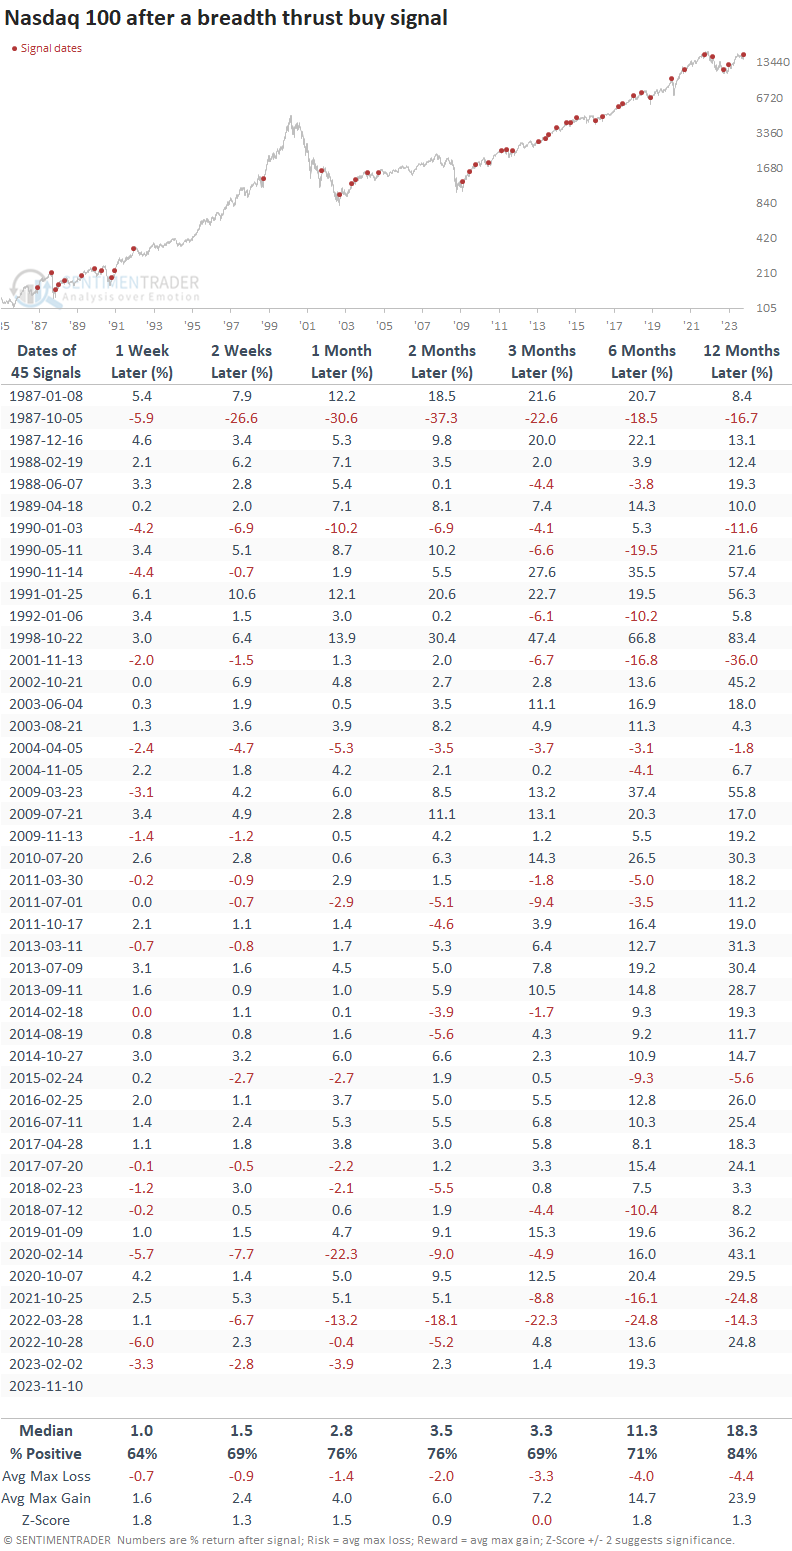
Similar breadth thrust signals preceded positive returns

When the 10-day sum of advancing issues compared to the 10-day sum of declining issues exceeds a ratio of 2.0, positive price momentum for the Nasdaq 100 will likely continue over the foreseeable future. Over the following three months, the signal showed a gain at some point in 40 out of 45 precedents. 
More thrust and reversal signals in Technology

A rare reversal for the Nasdaq 100 and S&P 500 Technology sector

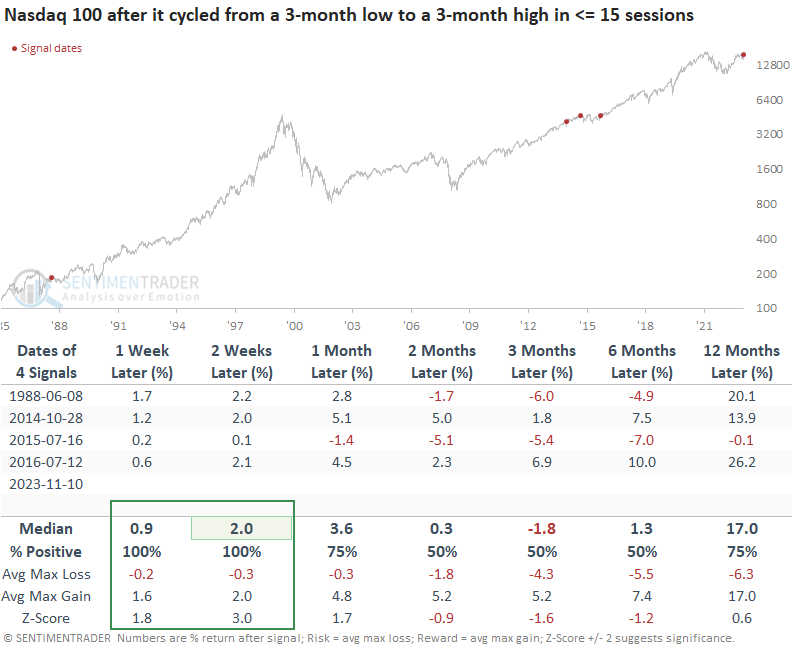
The bullish participation from stocks comprising the Nasdaq 100 mirrored favorable price action at the index level. For only the 5th time in history, the Nasdaq 100 cycled from a 3-month low to a 3-month high in 15 or fewer trading sessions.
More thrust and reversal signals in Technology

Similar price reversals suggest the positive momentum can continue

While the sample size is small, the Nasdaq 100 rallied every time over the subsequent two weeks whenever it cycled from a 3-month low to a 3-month high in 15 or fewer sessions.
More thrust and reversal signals in Technology

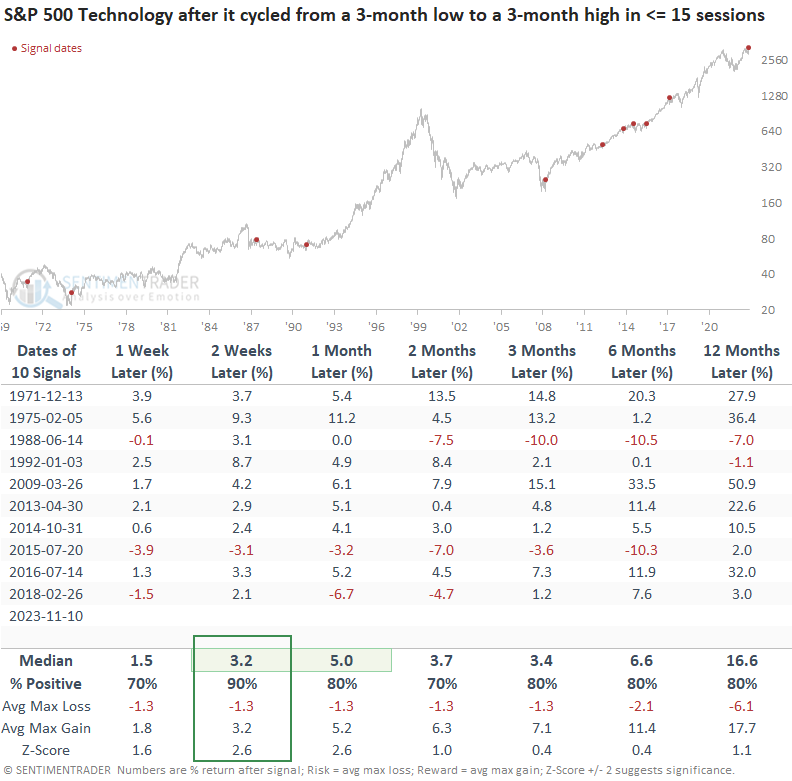
While the Nasdaq 100 and the S&P 500 Technology are driven by several of the same mega-cap members, the large-cap technology index also triggered the exact reversal pattern for the only 11th time since 1971.
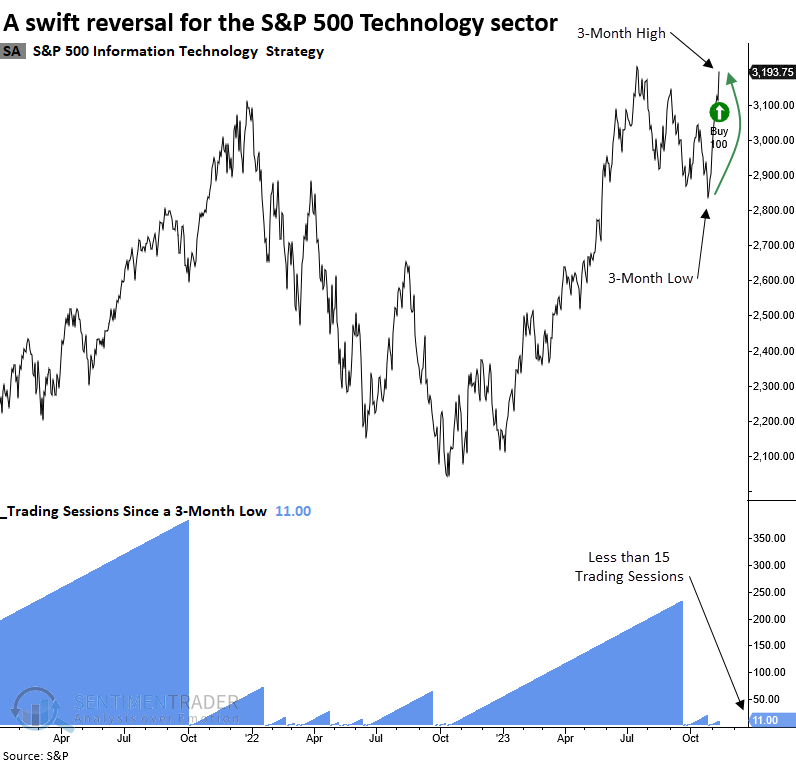
More thrust and reversal signals in Technology

Whenever the S&P 500 Technology sector cycled from a 3-month low to a 3-month high in 15 or fewer trading sessions, the sector was higher 90% of the time over the subsequent two weeks with a median gain of 3.2%. 
More thrust and reversal signals in Technology

What the research tells us...

The Nasdaq 100, a popular technology-dominated stock index, triggered its first breadth thrust buy signal in over nine months. Similar participation-based alerts led to further upside momentum for the index. The surge in technology-related companies sparked a rapid turnaround in the Nasdaq 100 and S&P 500 Technology sector, propelling these indices from their lowest points in the past three months to their highest levels in the same timeframe-accomplishing this remarkable feat in just under 15 trading sessions. Price momentum shifts, such as the one observed now, often translate into outstanding outcomes over the following two weeks and extended gains over longer horizons.

PRODUCTS
SentimenTrader
Trading Tools
Indicators & Data API
‍
Strategies & Scanner
‍
Research Reports
FREE
RESOUrCES
Simple Backtest
Calculator
Simple Seasonality
Calculator
The Kelly Criterion
Calculator
Sentiment Geo Map
‍
Public Research Reports
‍
Education
Sentiment Indicators
‍
Technical Indicators
‍
Pricing
Bundle pricing
‍
FAQ
‍
Announcements
‍
COMPANY
‍
About
‍
In the News
‍
Testimonials
‍
Client Success Stories
CONTACT
‍
General Inquiries
‍
Media Inquiries
‍
Financial Professionals Inquiries
‍
© 2026 Sundial Capital Research Inc. All rights reserved.
Setsail Marketing
TermsPrivacyAffiliate Program
Risk Disclosure: The information and tools provided are for research and analytical purposes only and are not intended as investment advice. Market analysis involves uncertainty, and outcomes may differ from expectations. Users should conduct their own due diligence and consider their individual circumstances before making any financial decisions. Past performance is not necessarily indicative of future results.

Hypothetical Performance Disclosure: Hypothetical performance results have many inherent limitations, some of which are described below. No representation is being made that any account will or is likely to achieve profits or losses similar to those shown; in fact, there are frequently sharp differences between hypothetical performance results and the actual results subsequently achieved by any particular trading program. One of the limitations of hypothetical performance results is that they are generally prepared with the benefit of hindsight. In addition, hypothetical trading does not involve financial risk, and no hypothetical trading record can completely account for the impact of financial risk of actual trading. for example, the ability to withstand losses or to adhere to a particular trading program in spite of trading losses are material points which can also adversely affect actual trading results. There are numerous other factors related to the markets in general or to the implementation of any specific trading program which cannot be fully accounted for in the preparation of hypothetical performance results and all which can adversely affect trading results.

Testimonial Disclosure: Testimonials appearing on this website may not be representative of other clients or customers and is not a guarantee of future performance or success.