
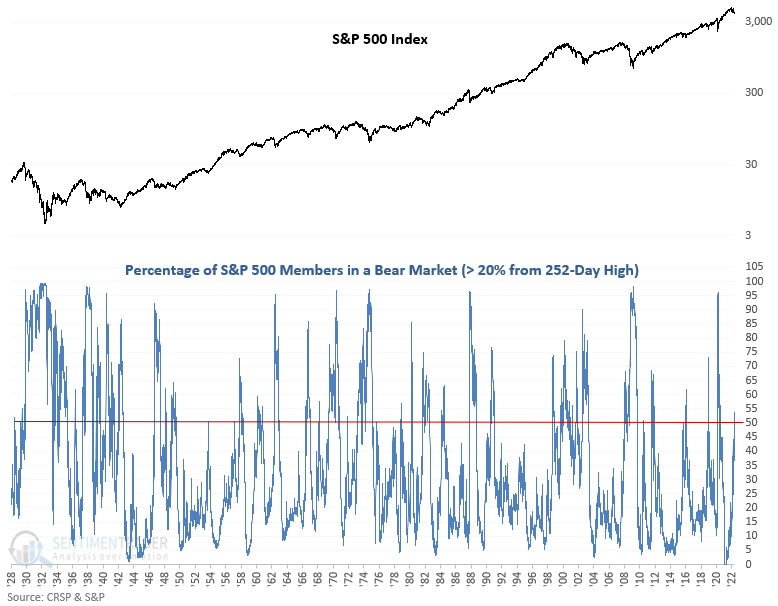
More than half of S&P 500 stocks are now in a bear market

Key points:
- More than half of S&P 500 stocks are down 20% or more from a 252-day high
- After similar signals, the index shows somewhat flat results in the near term
- The medium-term results look better, especially on a 3 & 6-month basis
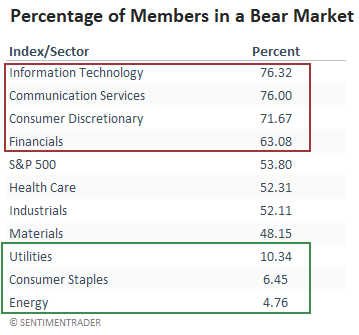
- However, if the number of members in a bear market moves above 63%, watch out below
What happens when more than half of S&P 500 stocks fall into a bear market
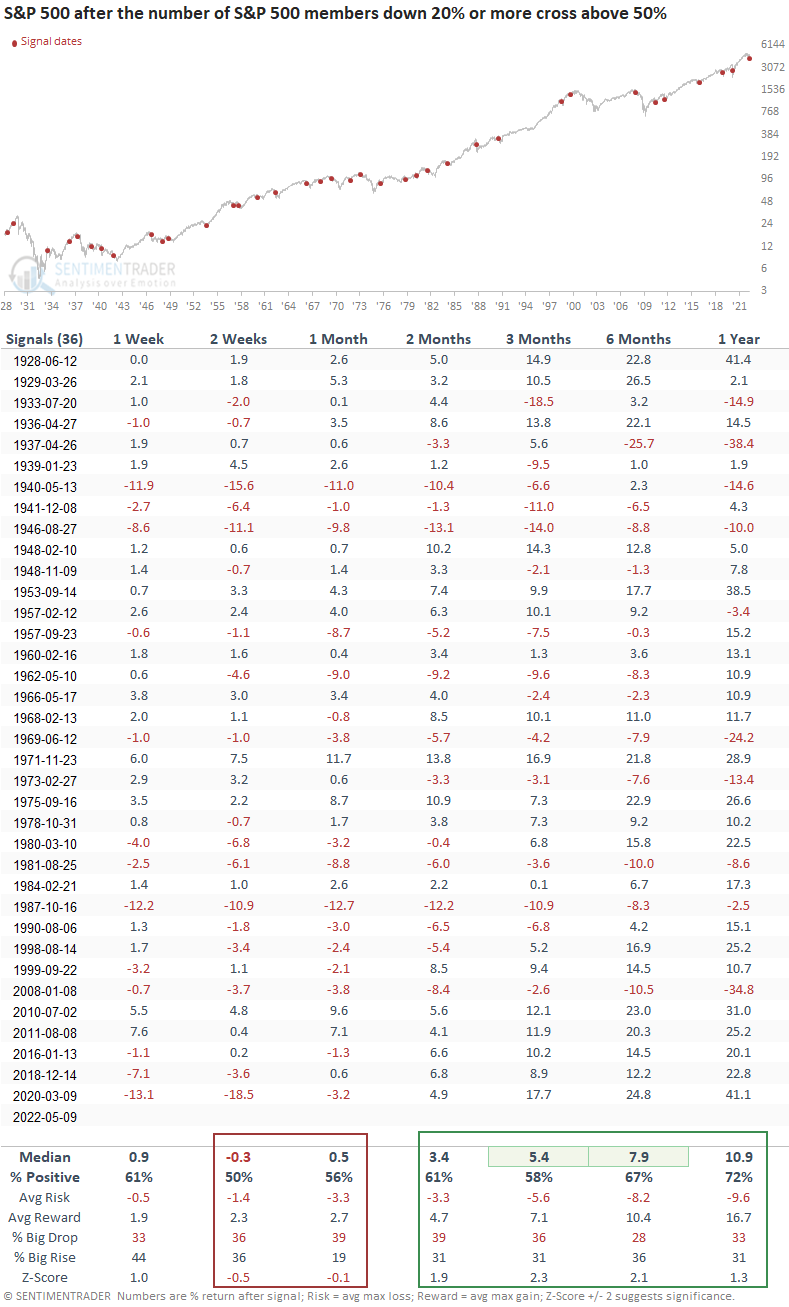
Let's assess the outlook for S&P 500 after the number of index members trading down 20% or more from a 252-day high cross above 50%. I will include a reset that requires the number of stocks in a bear market to fall below 25% before a new signal can trigger again.
Similar signals preceded a more favorable medium-term outlook
This study generated a signal 36 other times over the past 93 years. After the others, S&P 500 future returns, win rates, and risk/reward profiles were somewhat muddled in the near term. Signals since 1978 look slightly more troubling, with 11 out of 14 instances closing lower at some point in the first 4 weeks. However, the medium-term results look better, especially the 3 & 6-month time frames.
Watch this critical level for a sign that all is not well
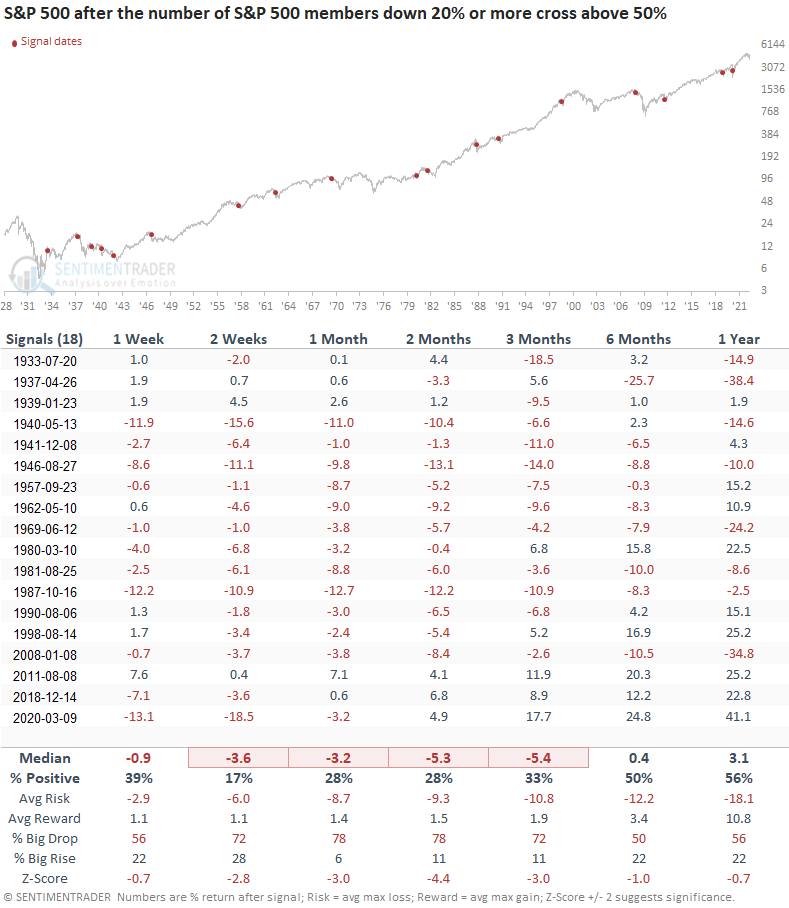
If I run an optimization to determine what level of bears provides the best stop loss for the signal, it returns 63%. So, we would exit the trade if the number of members in a bear market crossed above 63% or if 42 trading days passed. i.e., whichever comes first
The stop loss was triggered 18 times, representing 50% of the original study signals. Returns, win rates, and risk/reward profiles look abysmal across almost all time frames.
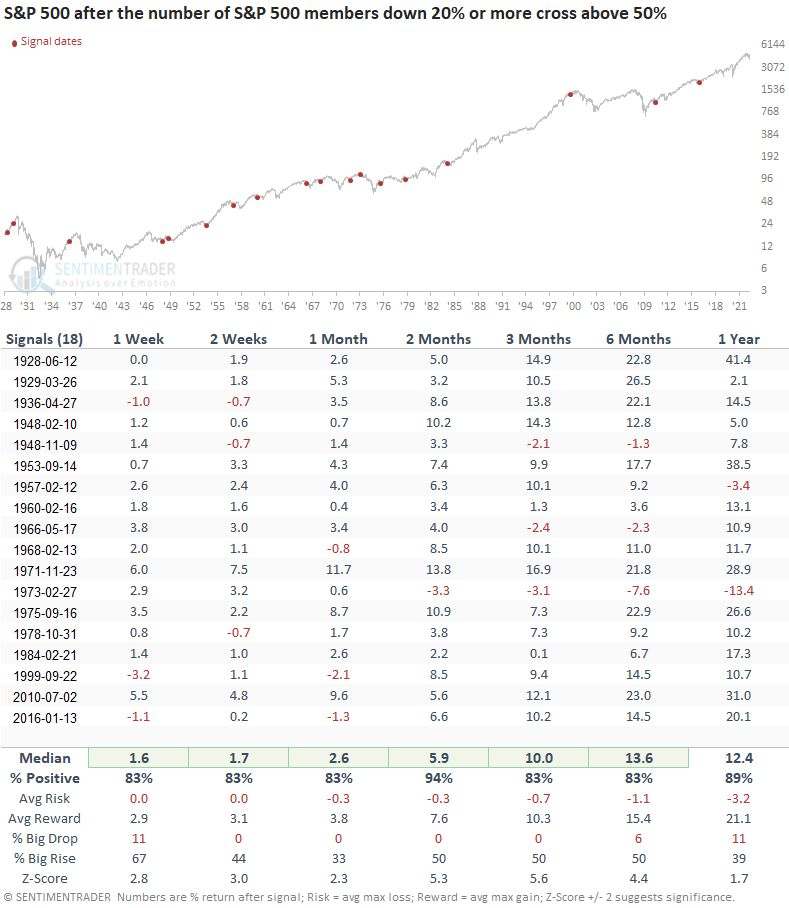
If we can avoid a cross above the stop loss level, the outlook improves dramatically
Returns, win rates, and risk/reward profiles look excellent across all time frames.
It's Energy, Staples, and Utilities versus everything else
What the research tells us...
Internal trends are unhealthy when the number of S&P 500 members trading down 20% or more from a 252-day high exceeds 50%. Sometimes, breadth can be so bad that it's good. Similar setups to what we're seeing now have preceded somewhat muddled returns in the near term with a more favorable outlook on a medium-term basis. However, if the number of members in a bear market increases above 63% in the subsequent months, the perspective turns highly unfavorable.