Data &
Technology
Research
Reports
Report Solutions
Reports Library
Actionable
Strategies
Free
Resources
Simple Backtest Calculator
Simple Seasonality Calculator
The Kelly Criterion Calculator
Sentiment Geo Map
Public Research Reports
Free Webinar
Pricing
Company
About
Meet Our Team
In the News
Testimonials
Client Success Stories
Contact
Log inLoginSign up
< BACK TO ALL REPORTS

More Than 80% of Stocks Show a Gain

Jason Goepfert
2021-10-05
In 2021, more than 80% of stocks in the S&P 500 showed a positive year-to-date return through the first 3 quarters. This was one of only six years in the past 40 to show such strong, broad-based returns among member stocks. Every other time it happened, stocks continued to gain into year-end.

There has been no shortage of remarkable stats about stocks in 2021. By late January, the uptrend was throwing traditional indicators out the window, and through June, stocks were showing some of the best trends in history. The ends of other long stretches of positive momentum have had a strong tendency to lead to only small, brief losses.

Most investors fixate on indexes like the S&P 500, and for a good reason. It's the most-benchmarked index in the world. Under the surface, it's been a tough row to hoe for stock-pickers, this year more than most.

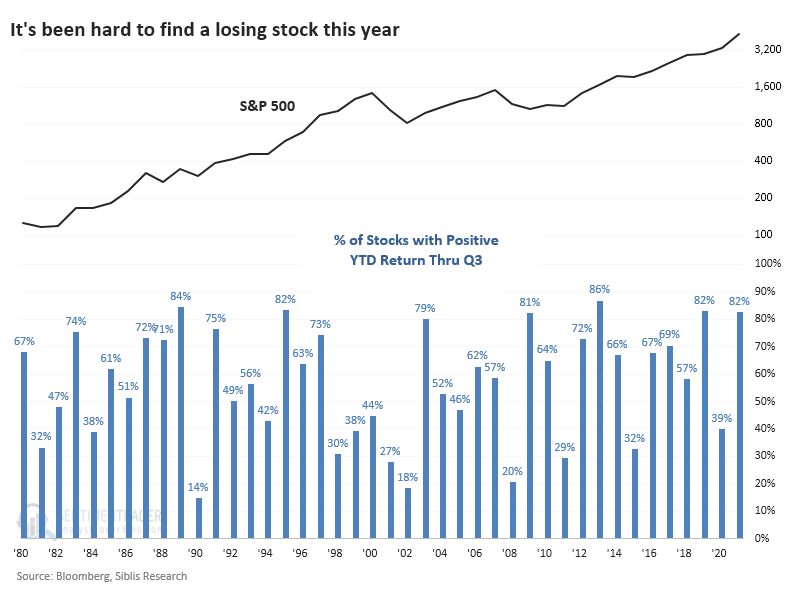
Even so, Bloomberg notes that most stocks in the S&P 500 show a positive return year-to-date.

"So far this year, 412 members of the S&P 500 are in the green, the third most for any year since at least 2001, according to data compiled by Bloomberg. Only five times since 2001 have more than 400 stocks been positive through September -- and every time the market added to those gains to cap off the year."

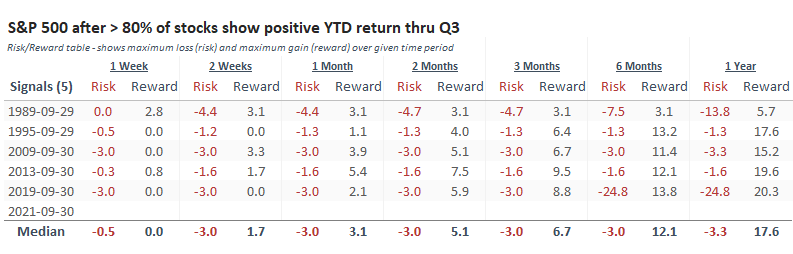
Indeed, this year marked one of the few in four decades when at least 80% of stocks sported a positive YTD return through the third quarter. Over that span, only six years accomplished this, four of which have been since the global financial crisis in 2008.

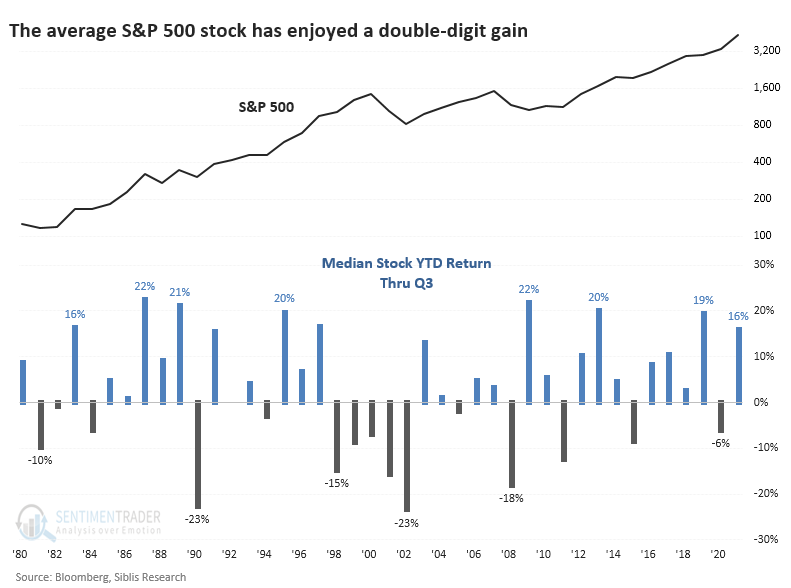
It's also been a year with some of the best gains. The median stock in the index returned 16% through Q3. That ties for 7th place among all years since 1980.

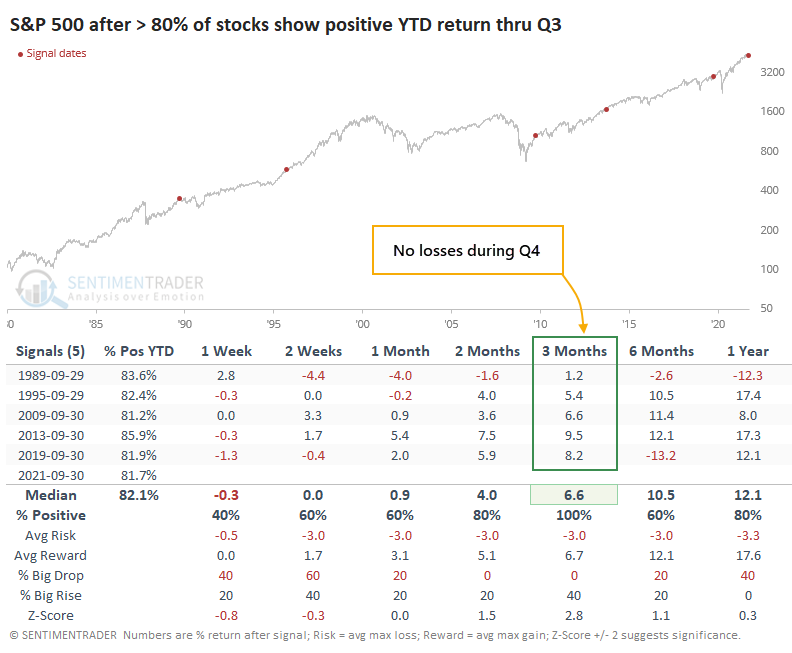
The five other times when more than 80% of stocks showed a positive return through the end of September, the S&P 500 index itself continued to rise through year-end each time, averaging an impressive return of +6.6%. Two of those ended up giving back the gains and then some in the months after that, though.

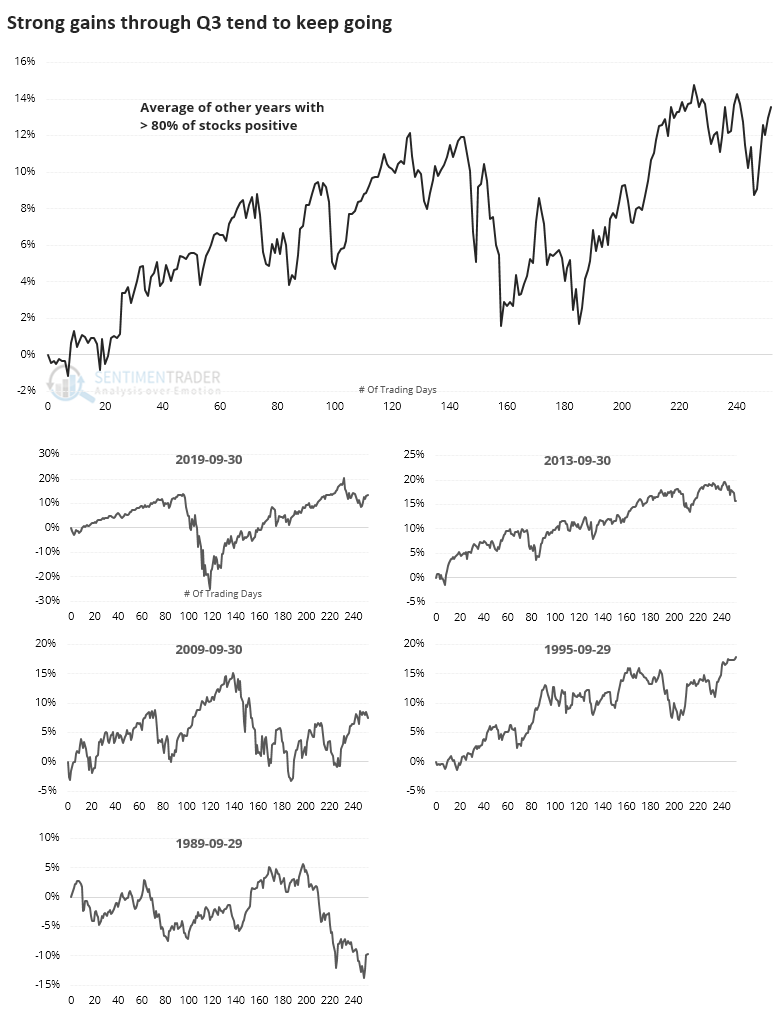
Looking at the (admittedly tiny) sample size visually, we can see the consistent tendency to see rising prices over the next three months at least before the index suffered chopper trading activity. The only standout was 1989, which barely showed a positive return over the next few months.

The Risk/Reward Table shows that risk was relatively small and front-loaded during October. Virtually all of the maximum drawdown over the next three months was suffered during the first couple weeks of October.

It's tough to have a lot of confidence with a sample size of five. If we relax the parameters to those years when 70% or more of stocks enjoyed a positive YTD return through Q3 (instead of 80% or more), the conclusion was essentially the same. Those years perhaps suffered some October volatility but showed a strong tendency for a positive return over the next three months. The only big exception - and it was BIG - was 1987.

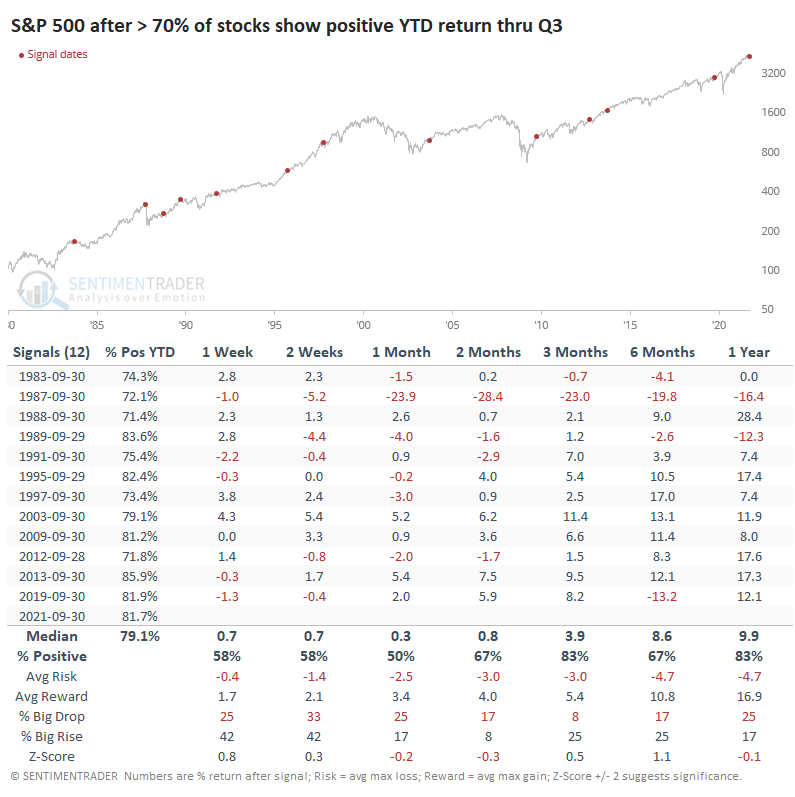
Like we've seen with virtually every momentum study in 2021, and there have been a lot of them, buyers do not tend to stop after having the capacity to push prices persistently higher for months on end. Any short-term volatility is viewed as the first real good buying opportunity in months, if not longer, and they tend to participate with enthusiasm. The calendar is also proving to be a tailwind, suggesting that a rough start to October should quickly bring in buying interest.

Sorry, you don't have access to this report

Upgrade your subscription plan to get access
Go to Dasboard
DATA &
TECHnologies
IndicatorEdge
‍
BackTestEdge
‍
Other Tools
‍
DataEdge API
RESEARCH
reports
Research Solution
‍
Reports Library
‍
actionable
Strategies
Trading Strategies
‍
Smart Stock Scanner
‍
FREE
RESOUrCES
Simple Backtest
Calculator
Simple Seasonality
Calculator
The Kelly Criterion
Calculator
Sentiment Geo Map
‍
Public Research Reports
‍
Free Webinar
COMPANY
‍
About
‍
Meet our Team
‍
In the News
‍
Testimonials
‍
Client Success Stories
Pricing
Bundle pricing
‍
Announcements
‍
FAQ
© 2024 Sundial Capital Research Inc. All rights reserved.
Setsail Marketing
TermsPrivacyAffiliate Program
Risk Disclosure: Futures and forex trading contains substantial risk and is not for every investor. An investor could potentially lose all or more than the initial investment. Risk capital is money that can be lost without jeopardizing ones’ financial security or life style. Only risk capital should be used for trading and only those with sufficient risk capital should consider trading. Past performance is not necessarily indicative of future results.

Hypothetical Performance Disclosure: Hypothetical performance results have many inherent limitations, some of which are described below. No representation is being made that any account will or is likely to achieve profits or losses similar to those shown; in fact, there are frequently sharp differences between hypothetical performance results and the actual results subsequently achieved by any particular trading program. One of the limitations of hypothetical performance results is that they are generally prepared with the benefit of hindsight. In addition, hypothetical trading does not involve financial risk, and no hypothetical trading record can completely account for the impact of financial risk of actual trading. for example, the ability to withstand losses or to adhere to a particular trading program in spite of trading losses are material points which can also adversely affect actual trading results. There are numerous other factors related to the markets in general or to the implementation of any specific trading program which cannot be fully accounted for in the preparation of hypothetical performance results and all which can adversely affect trading results.

Testimonial Disclosure: Testimonials appearing on this website may not be representative of other clients or customers and is not a guarantee of future performance or success.