Data &
Technology
Research
Reports
Report Solutions
Reports Library
Actionable
Strategies
Free
Resources
Simple Backtest Calculator
Simple Seasonality Calculator
The Kelly Criterion Calculator
Sentiment Geo Map
Public Research Reports
Free Webinar
Pricing
Company
About
Meet Our Team
In the News
Testimonials
Client Success Stories
Contact
Log inLoginSign up
< BACK TO ALL REPORTS

More evidence of eager buyers amid breadth thrusts

Jason Goepfert
2022-01-05
Over the past couple of weeks, there has been a thrust in the percentage of stocks and other securities advancing versus declining. Similar thrusts, especially when coming after oversold conditions, have consistently preceded further gains.

Key points:

  • Over the past 10 days, there has been an impressive thrust in Up Issues and Up Volume
  • That's the case for stocks in the S&P 500 and NYSE securities generally
  • Similar thrusts had a consistent record of preceding further gains

It's been a "thrusty" couple of weeks

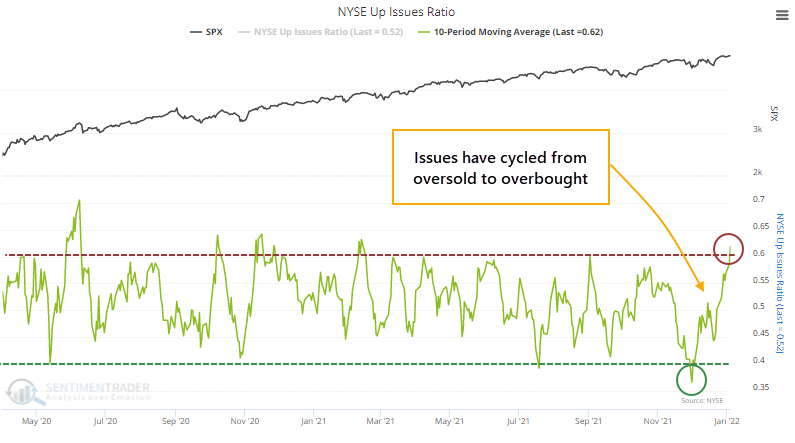
Over the past couple of weeks, Dean and I have outlined several breadth thrusts in the broader market and some individual sectors. The relatively broad-based nature of the recent rise has also triggered a thrust in NYSE Up Issues. Over the past 2 weeks, an average day has witnessed 62% of securities advancing.

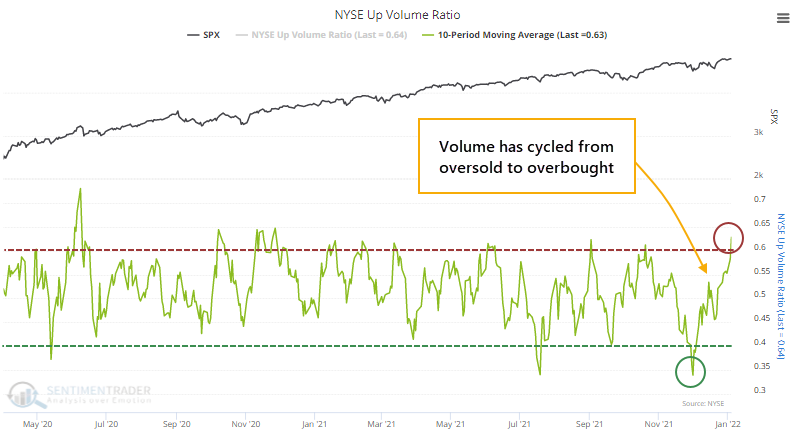
More than 63% of volume has been focused on those advancing securities, also triggering a thrust in NYSE Up Volume.

Thrusts have had a good short-term (and long-term) track record

There are an infinite number of ways to measure breadth and thrusts. We don't subscribe to the idea that there are official rules for either. We test them from many different perspectives with the sole purpose of trying to discover whether investors are eager to own stocks or not and what that might suggest for how they'll behave going forward.

When both the 10-day Up Issues and Up Volume ratios cycle from below 40% to above 60% within 30 days, it suggested that investors will keep buying, especially when the S&P 500 was within correction territory of less than a 10% drawdown from a multi-year high.

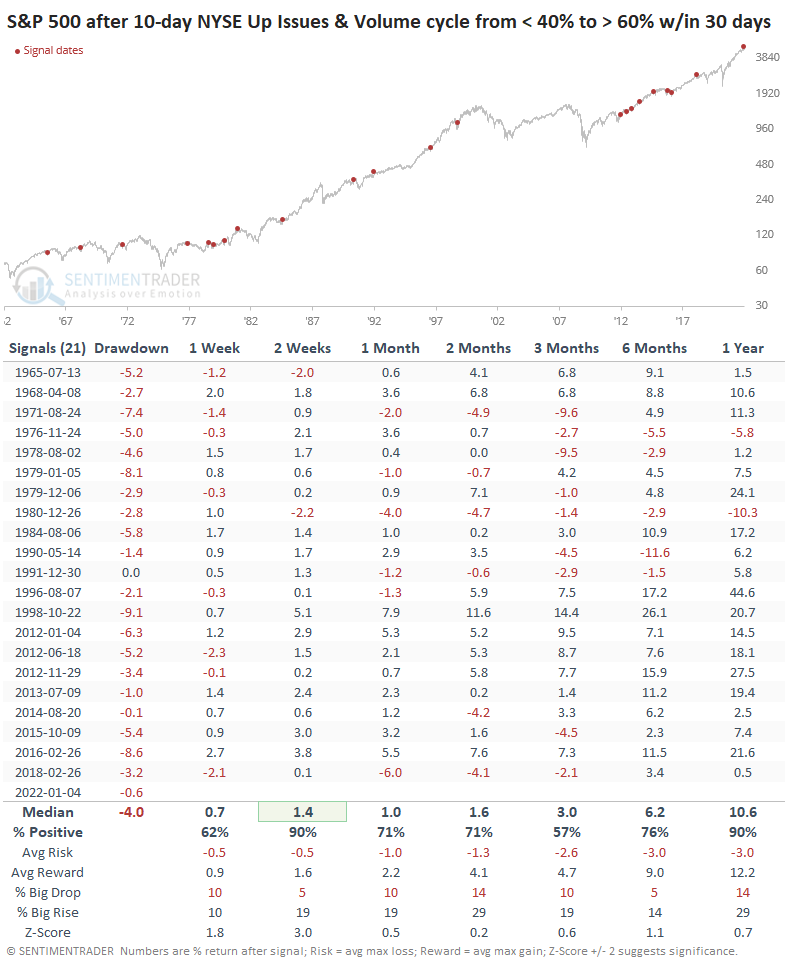
Over the next 2 weeks, the S&P continued to rally after 19 out of 21 signals. Because these also indicated overbought conditions, the index had a habit of settling back over the next few months, but losses tended to be relatively minor. Over the next year, all but 2 of the signals showed a profit, with an excellent risk/reward ratio.

S&P 500 stocks have been just as impressive

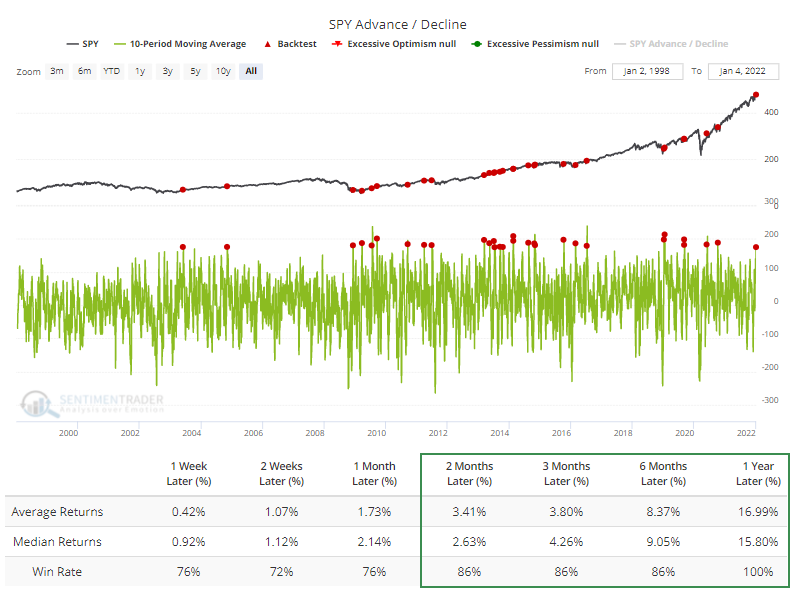
Within just the S&P 500 itself, over the past 10 sessions, there have been an average of 175 more advancing stocks than declining ones. The only two times this has happened in recent years, it preceded pullbacks.

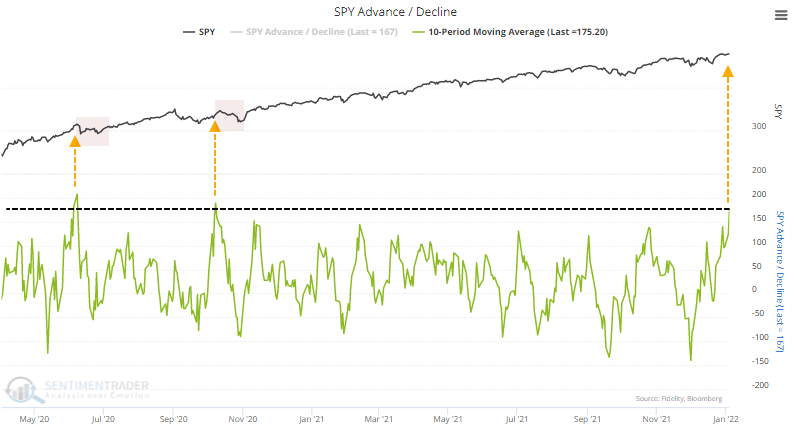
But the Backtest Engine shows that such impressive buying interest has preceded gains in the months ahead with consistency, and a year later, all 29 signals showed a positive return.

What the research tells us...

We tend to place more weight on thrust signals that occur after a protracted downtrend. Those have a historical success rate that's hard to beat. It's a bit scary to rely on them when stocks are trading at/near all-time highs because it also suggests overbought conditions and the possibility of a blow-off peak. While stocks have pulled back in the months after several similar signals to what we're seeing now, they have tended to be relatively minor and short-lived. None of them preceded an imminent bear market.

Sorry, you don't have access to this report

Upgrade your subscription plan to get access
Go to Dasboard
DATA &
TECHnologies
IndicatorEdge
‍
BackTestEdge
‍
Other Tools
‍
DataEdge API
RESEARCH
reports
Research Solution
‍
Reports Library
‍
actionable
Strategies
Trading Strategies
‍
Smart Stock Scanner
‍
FREE
RESOUrCES
Simple Backtest
Calculator
Simple Seasonality
Calculator
The Kelly Criterion
Calculator
Sentiment Geo Map
‍
Public Research Reports
‍
Free Webinar
COMPANY
‍
About
‍
Meet our Team
‍
In the News
‍
Testimonials
‍
Client Success Stories
Pricing
Bundle pricing
‍
Announcements
‍
FAQ
© 2024 Sundial Capital Research Inc. All rights reserved.
Setsail Marketing
TermsPrivacyAffiliate Program
Risk Disclosure: Futures and forex trading contains substantial risk and is not for every investor. An investor could potentially lose all or more than the initial investment. Risk capital is money that can be lost without jeopardizing ones’ financial security or life style. Only risk capital should be used for trading and only those with sufficient risk capital should consider trading. Past performance is not necessarily indicative of future results.

Hypothetical Performance Disclosure: Hypothetical performance results have many inherent limitations, some of which are described below. No representation is being made that any account will or is likely to achieve profits or losses similar to those shown; in fact, there are frequently sharp differences between hypothetical performance results and the actual results subsequently achieved by any particular trading program. One of the limitations of hypothetical performance results is that they are generally prepared with the benefit of hindsight. In addition, hypothetical trading does not involve financial risk, and no hypothetical trading record can completely account for the impact of financial risk of actual trading. for example, the ability to withstand losses or to adhere to a particular trading program in spite of trading losses are material points which can also adversely affect actual trading results. There are numerous other factors related to the markets in general or to the implementation of any specific trading program which cannot be fully accounted for in the preparation of hypothetical performance results and all which can adversely affect trading results.

Testimonial Disclosure: Testimonials appearing on this website may not be representative of other clients or customers and is not a guarantee of future performance or success.