
More evidence of a narrow market breadth environment

Key points:
- Sub-industry group trends are deteriorating relative to the S&P 500
- After similar divergences, returns for the S&P 500 were bullish across most time frames
- When slumping participation follows a period of healthy participation, results are excellent
Should we be concerned about an increasingly narrow market environment
Jason and I have recently shared several research notes highlighting narrow participation or divergence patterns. While the evidence of a thin market is irrefutable, the outcome for stocks after similar periods is far less bearish than some would have you believe.
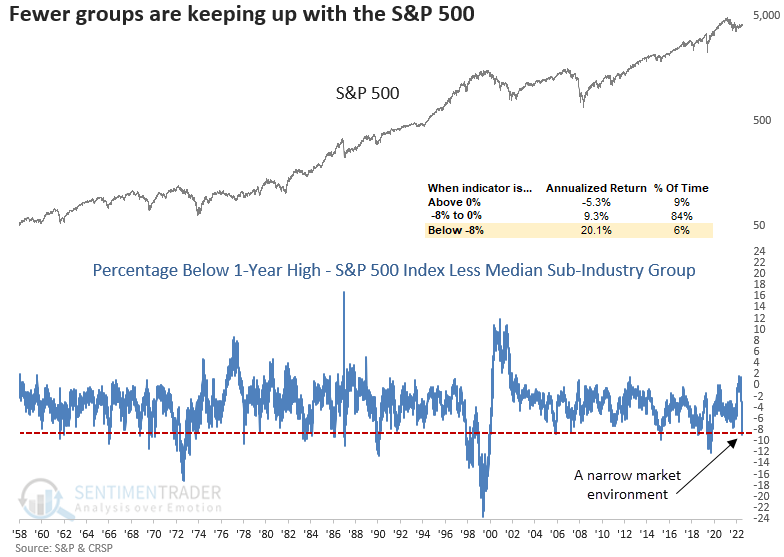
Over the weekend, I ran across a breadth-based chart from Goldman Sachs Global Investment Research. The indicator measures how far the S&P 500 closed below its rolling 52-week high in percentage terms and compares it to the median S&P 500 stock distance.
I recreated the indicator using sub-industry groups instead of S&P 500 stocks. While it's not an apples-to-apples comparison, as the sub-industry data contains large, medium, and small-cap stocks, it should provide a good proxy for measuring participation similar to the Goldman concept.
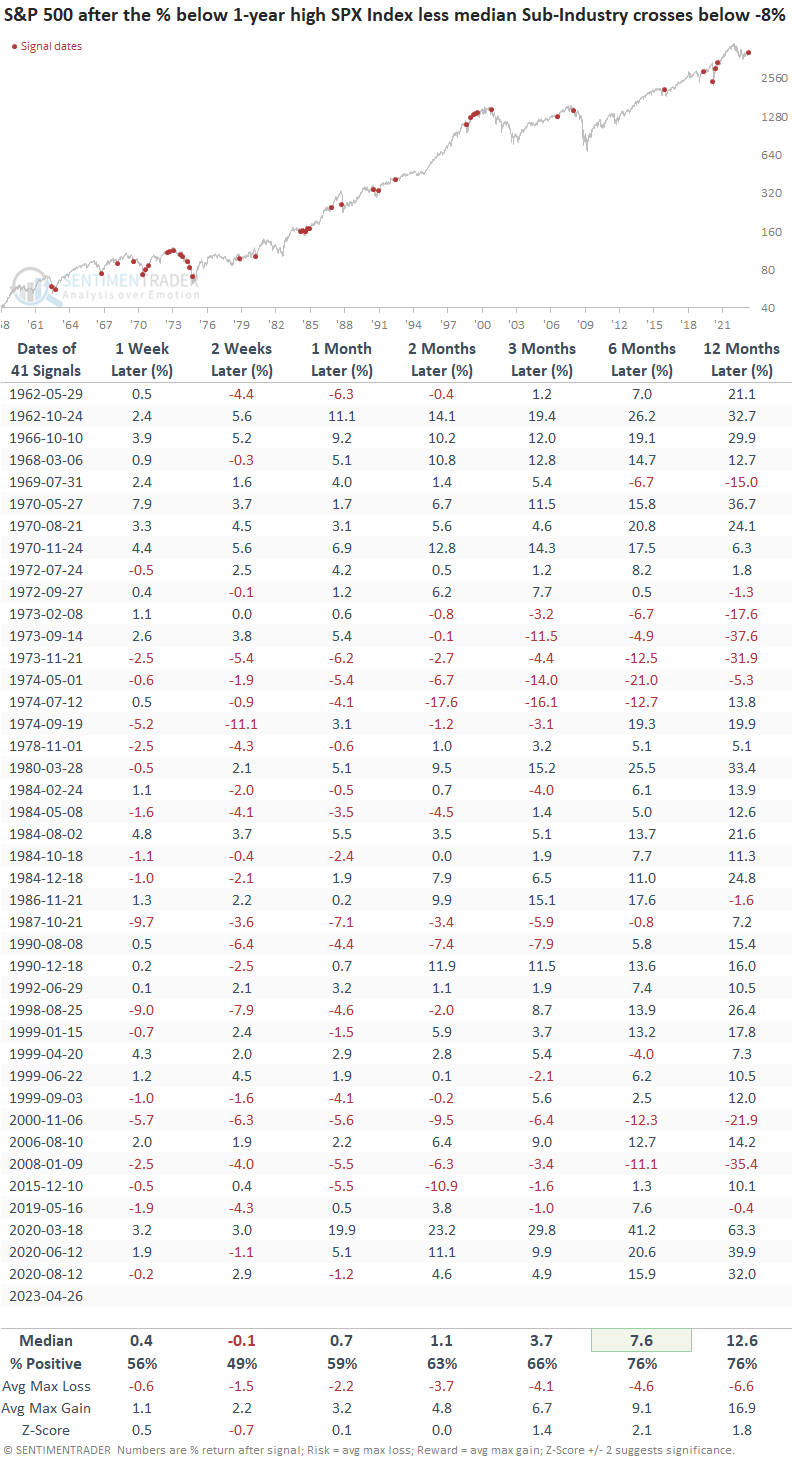
Last week, the percentage spread from a 1-year high between the S&P 500 and the median sub-industry group crossed below -8% for the first time since August 2020. While counterintuitive, annualized returns for the S&P 500 are significantly better when the spread declines to a level associated with a deteriorating market breadth environment, like now.
Let's assess the outlook for the S&P 500 using a signal-driven approach that captures a cross below -8% rather than a bracket-based methodology that measures annualized returns when the indicator is below that level.
Similar spread contractions led to mostly positive returns
When the spread falls below -8%, the S&P 500 tends to trend upward over time after the first few weeks. A cluster of signals occurred in 1970, 1972-74, 1984, 1998-99, and 2020. Except for 1972-74, those precedents were more bullish than bearish.
I screened out repeat instances by identifying the first alert in two months.
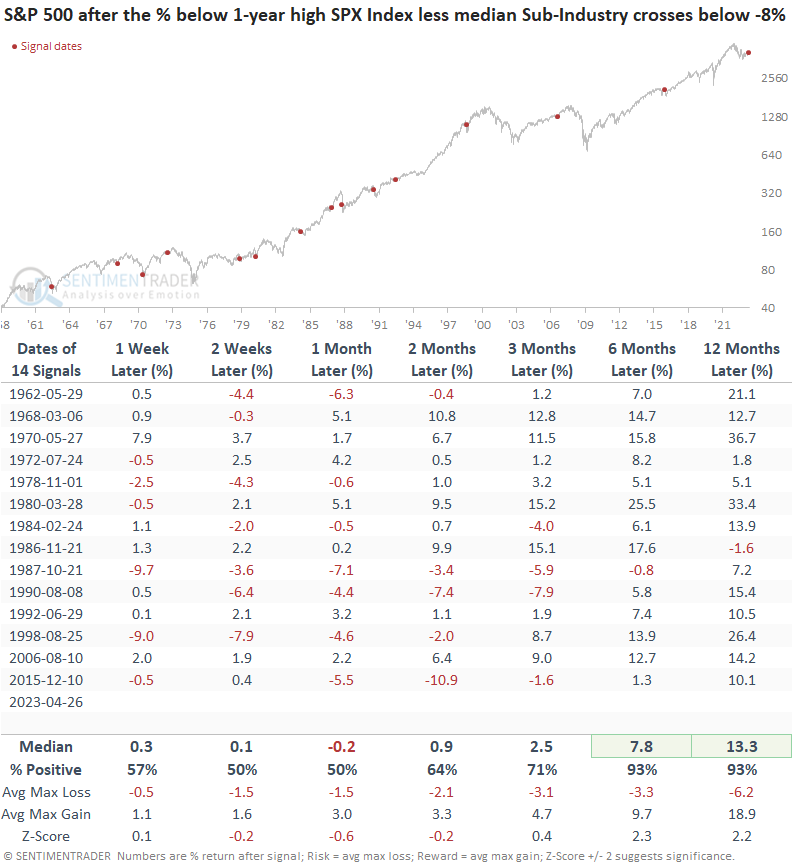
Let's add some context to the signal. Before the recent indicator deterioration, the spread closed above 0%. i.e., sub-industry groups looked better than the S&P 500.
I will now identify the first cross below -8% after the spread reset above 0%.
While the first month is somewhat mixed, the six and twelve-month returns and win rates are excellent. So, we must remember that the initial warning of a narrow market environment is often not the one where a cautious stance is warranted.
What the research tells us...
Market strategist Bob Farrell was fond of saying, "Markets are strongest when they are broad and weakest when they narrow to a handful of stocks." While I agree with his statement and have put it into practice with the TCTM Composite Risk Waning Model, measuring a negative breadth divergence is challenging. More often than not, the pattern corrects itself via sector rotation. Last week, the percentage spread from a 1-year high between the S&P 500 and the median sub-industry group crossed below -8%, indicating a deteriorating market breadth backdrop. After similar alerts, the S&P 500 was more inclined to rally, especially if the signal occurred after the spread closed above 0%.