
More Continuation Signals in a Choppy Market

Key points:
- Recent notes highlighted unfavorable factors for stocks (many new highs and new lows, and concerns regarding seasonal weakness)
- Nevertheless, signals from other indicators suggest an ultimate bull market continuation
- Signals from our Risk On / Risk Off and VXX Optix indicators have added weight to the favorable side of the weight of the evidence ledger
The stock market is hanging on
Some warning signs (see here and here) and conflict in the Middle East have stock market investors on edge, and understandably so. Despite all of this - for now anyway - the major stock market indexes are holding in an uptrend. The chart below shows price action for the S&P 500 Index and the 200-day moving average.
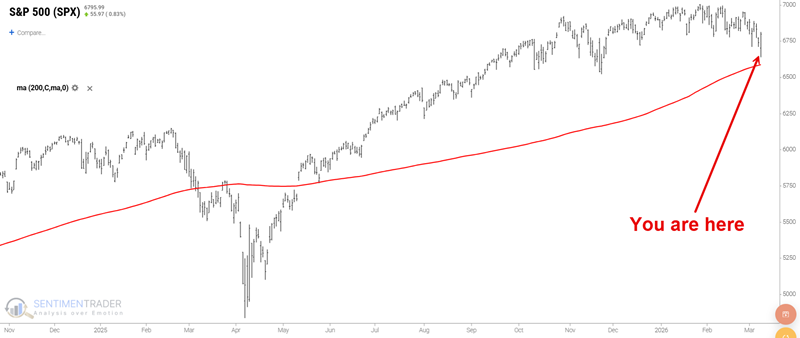
While countless predictions about whether the uptrend will hold abound, in the here and now, as long as the index holds above its 200-day moving average, it is technically accurate to say the market is in an uptrend. This suggests that long-term investors should ignore their fears and sit tight for now, and that shorter-term traders can still look for opportunities to play the long side of the market.
Risk On / Risk Off weakens….BUT
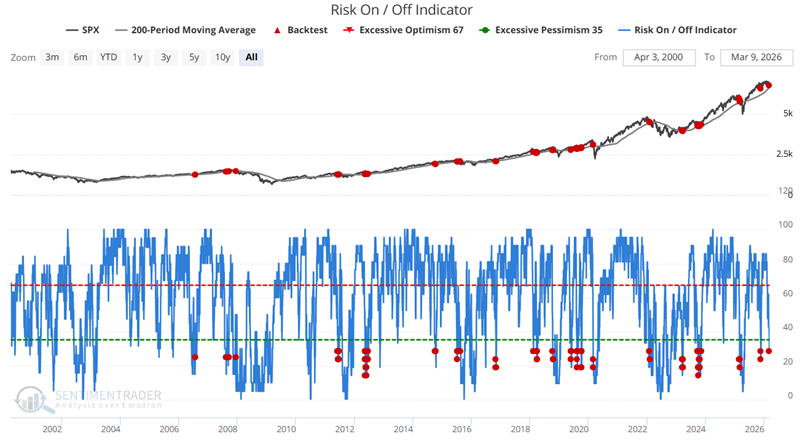
This recent piece highlights the sharp decline in our Risk On / Risk Off indicator and correctly points to potential short-term weakness in stocks. However, the article also highlights that sharp declines in RORO often set the stage for longer-term rebounds. This is especially true when the indicator gets oversold within the context of a broader market uptrend.
The chart below highlights all dates when the Risk On/ Risk Off indicator was below 30 while the S&P 500 Index was above its 200-day moving average. The most recent signals occurred on March 6th and March 9th.
The table below summarizes subsequent SPX performance.

This is definitely a "weight of the evidence" type of signal, not something to rely on as a standalone trading model. With that caveat in mind, the high Win Rates (especially for 1-Year) and above-average Median Returns suggest that longer-term investors give the market some more leeway, particularly as long as the S&P 500 (and other major indexes like the Dow, Nasdaq 100, and Russell 2000) holds above its 200-day moving average.
VXX Optix flashes a continuation signal
The iPath Series B S&P 500 VIX Short-Term Futures ETN (VXX) is an Exchange-Traded Note (i.e., a senior unsecured debt instrument issued by Barclays Bank) designed to provide exposure to S&P 500 VIX Short-Term Futures.
High VXX readings suggest elevated fear among traders. Therefore, while low Optix readings for most securities signal fear, the opposite is true for ticker VXX. High VXX Optix readings imply that short-term volatility traders are fearful of a market decline. Within the context of a broader market uptrend, this type of action can often serve as a "continuation" signal.
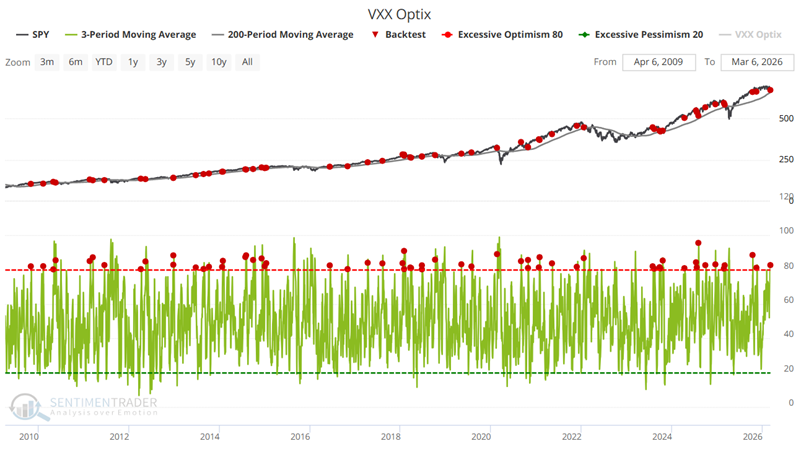
A 3-day VXX Optix average above 80 indicates a spike in fear. As a contrary indicator, this can be a favorable sign. Having this happen while SPY is still above its 200-day average suggests we are witnessing a normal pullback within an ongoing uptrend.
The chart below highlights all dates when the 3-day average of our VXX Optix indicator crossed above 80 while the ticker SPY closed above its 200-day moving average. The most recent signal occurred on March 6th.
The tables below summarize subsequent SPY performance.

Once again, this is an indicator signal that should not be relied upon as the sole trigger for entering a bullish trade or position. However, as part of a broader weight-of-the-evidence approach, it falls into the "Ignore the headlines and focus on the trend" category.
What the research tells us…
There is little question that there has been some churning in the market and deterioration in market breadth in recent months. Likewise, the potential ripple effects of recent geopolitical events could significantly impact the economy and the market. Nevertheless, the adage of "Listen to the market" seems appropriate here. For now, the major market indices are holding above their long-term moving averages, and oversold signals are emerging. Historically, this configuration has led to market rebounds more often than not.