Products
SentimenTrader Trading Tools
‍
Backtest Engine
My Trading Toolkit
Correlation Analysis
Seasonality
Market Prediction
Indicators & Data API
‍
Proprietary Indicators & Charts
Market Data API
Strategies & Scanner
‍
50+ Trading Strategies
Smart Stock Scanner
Smart Option Scanner
Research Reports
‍
Research Solutions
Reports Library
Free Resources
Simple Backtest Calculator
Simple Seasonality Calculator
The Kelly Criterion Calculator
Sentiment Geo Map
Public Research Reports
Education
Sentiment Indicators
Technical Indicators
Pricing
Company
About
In the News
Testimonials
Client Success Stories
Contact
Log inLoginSign up
< BACK TO ALL REPORTS

More big tech stocks fall into corrections and bear markets

Jason Goepfert
2024-07-30
There has been weakness in Nasdaq 100 component stocks for a couple of months, and that finally led to some selling in the index over the past couple of weeks. Stocks in corrections and bear markets have spiked above thresholds not normally seen during ongoing bull markets. Watching for short-term buy-the-dip behavior may tell us much about the longer term prospects.

Key points:

  • With recent weakness, more than 60% of Nasdaq 100 stocks are in corrections, and 30% in bear markets
  • During healthy bull markets, these thresholds are rarely breached and typically bring in buyers
  • If buy-the-dip is no longer in force, the breach of these levels ushers in some ugly precedents

A market environment filter

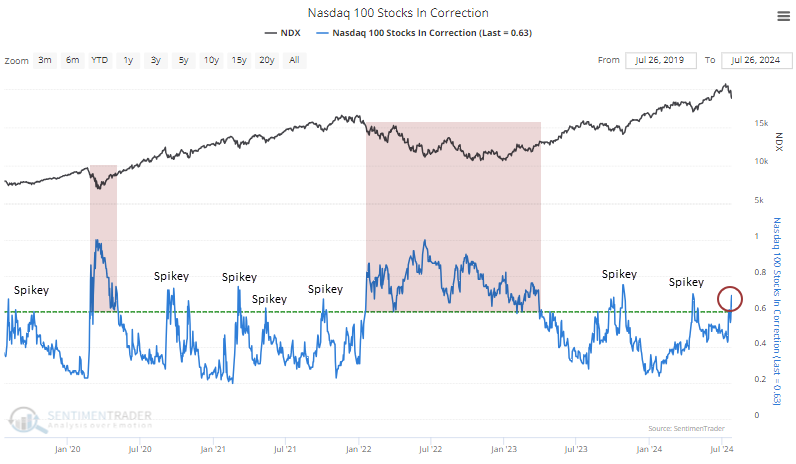
More and more tech stocks have been wobbling. In June, we saw how unusual it was to see the Nasdaq 100 (NDX) index hitting new highs while many of its stocks were in corrections, down more than 10% from their highs.

Now that the index has pulled back, we've seen more stocks getting hit, and the percentage of stocks in a correction has spiked above 60%. We'll usually see fewer than 60% of NDX stocks in corrections during healthy bull markets. If it reaches that level (like now), it's almost always "spiky" and quickly falls below that threshold as buyers step in. 

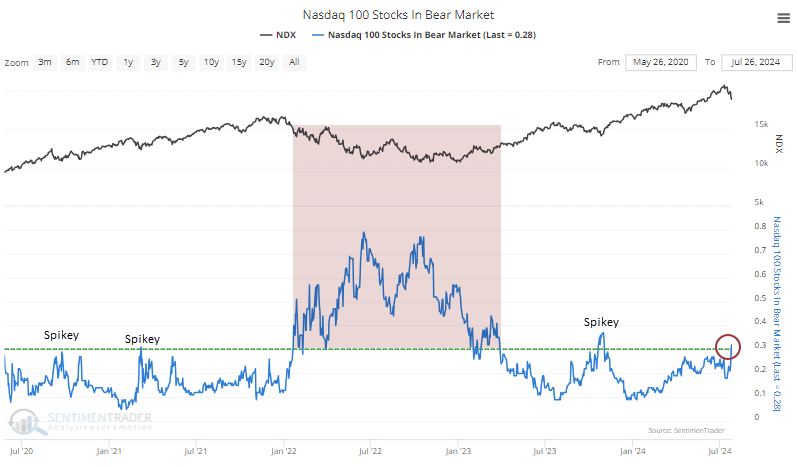
The same goes for stocks in deeper trouble. The percentage of stocks in bear markets has jumped as well, to the highest level in more than six months. During bull markets, this figure routinely stays below 30%, and if it nears or exceeds that threshold, it tends to be near the ends of pullbacks. 

Watch for buy-the-dip

The table below shows each date when the Nasdaq 100 ended a streak of at least six months with fewer than 60% of its members in corrections and 30% in bear markets. Returns for the index were mixed over the next couple of months, with a few decent gains and a few moderate losses.

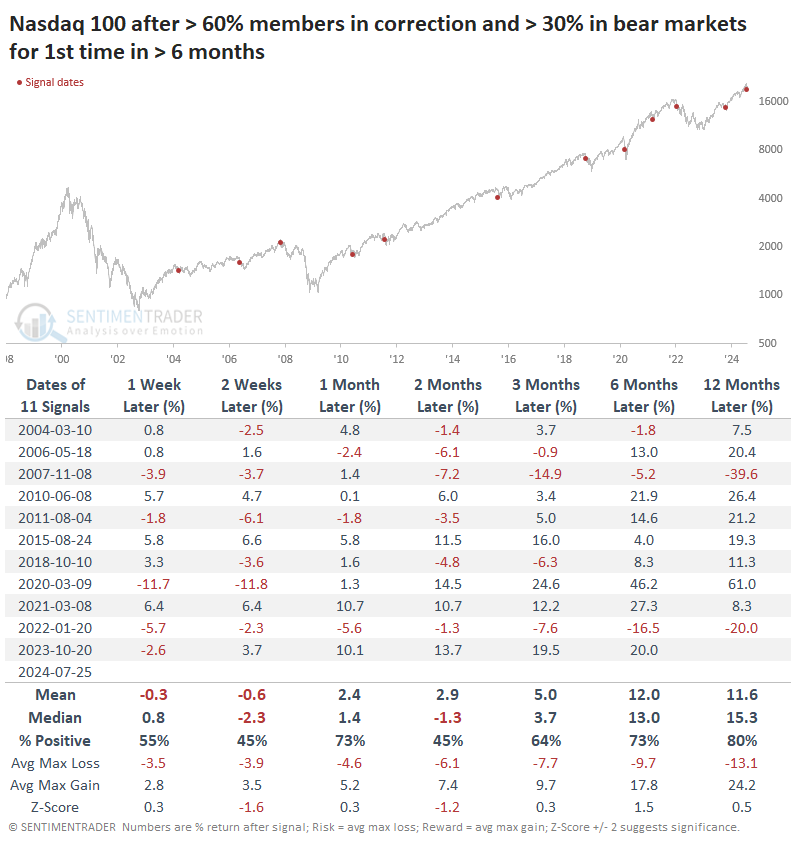
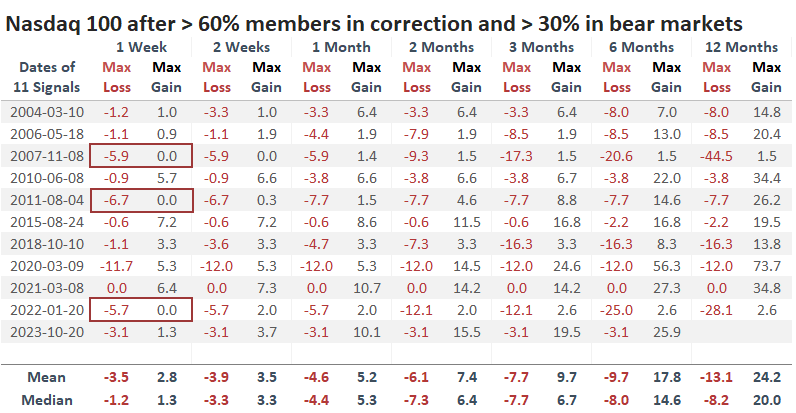
One thing that stands out is how traders behaved in the short term. There were three instances when there was absolutely no buy-the-dip mentality, and two of those preceded protracted bear markets. The other, in 2011, led to a bit more weakness then an impressive rally.

A fairly strong positive correlation existed between the maximum gain over the next week and the ending return one year later. There isn't a lot of data here, but it suggests that if we don't see any interest from dip-buyers in the days ahead, we should be wary.

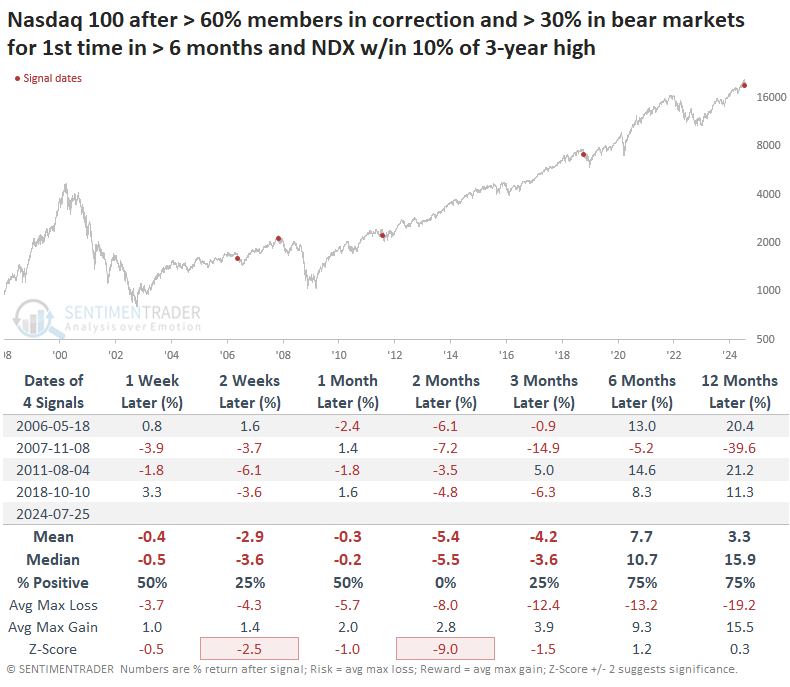
At the risk of making a small sample size even smaller, the table below filters the dates to only include those when the NDX index was within 10% of a multi-year high. These are times when the index was holding up relatively well compared to its component stocks. 

One might think that these displays of relative strength were good, but two months later, the NDX sported a negative return all four times. That shorter-term weakness was about it for three of the instances, as they went on to show double-digit gains over the next ten months.

What the research tells us...

There is little doubt that risk appetite has been strong for a historically long time. That's not necessarily bad, as it usually suggests that investors have been conditioned to treat any pullback as a bargain, so they'll be more willing to commit funds the next time. Things tend to get hairy when that stops working, and a buy-the-dip mentality is no longer in vogue. After ends of streaks in the Nasdaq 100 and its components like we just saw, it should pay to watch how traders react. It ushers in some ugly precedents if they don't show much buy-the-dip eagerness. 

PRODUCTS
SentimenTrader
Trading Tools
Indicators & Data API
‍
Strategies & Scanner
‍
Research Reports
FREE
RESOUrCES
Simple Backtest
Calculator
Simple Seasonality
Calculator
The Kelly Criterion
Calculator
Sentiment Geo Map
‍
Public Research Reports
‍
Education
Sentiment Indicators
‍
Technical Indicators
‍
Pricing
Bundle pricing
‍
FAQ
‍
Announcements
‍
COMPANY
‍
About
‍
In the News
‍
Testimonials
‍
Client Success Stories
CONTACT
‍
General Inquiries
‍
Media Inquiries
‍
Financial Professionals Inquiries
‍
© 2026 Sundial Capital Research Inc. All rights reserved.
Setsail Marketing
TermsPrivacyAffiliate Program
Risk Disclosure: The information and tools provided are for research and analytical purposes only and are not intended as investment advice. Market analysis involves uncertainty, and outcomes may differ from expectations. Users should conduct their own due diligence and consider their individual circumstances before making any financial decisions. Past performance is not necessarily indicative of future results.

Hypothetical Performance Disclosure: Hypothetical performance results have many inherent limitations, some of which are described below. No representation is being made that any account will or is likely to achieve profits or losses similar to those shown; in fact, there are frequently sharp differences between hypothetical performance results and the actual results subsequently achieved by any particular trading program. One of the limitations of hypothetical performance results is that they are generally prepared with the benefit of hindsight. In addition, hypothetical trading does not involve financial risk, and no hypothetical trading record can completely account for the impact of financial risk of actual trading. for example, the ability to withstand losses or to adhere to a particular trading program in spite of trading losses are material points which can also adversely affect actual trading results. There are numerous other factors related to the markets in general or to the implementation of any specific trading program which cannot be fully accounted for in the preparation of hypothetical performance results and all which can adversely affect trading results.

Testimonial Disclosure: Testimonials appearing on this website may not be representative of other clients or customers and is not a guarantee of future performance or success.