
Bear markets are rising in big tech

Key points:
- As the Nasdaq 100 recently closed at new highs, more stocks in the index were falling 20% from their highs
- This is a severe divergence between the index and its component stocks, last seen in late 2021
- Outside of the 1998-99 internet bubble blow-off, similar divergences preceded weak returns over the next few months
A bull market in bear markets
Last week, we saw that fewer stocks in the tech-heavy Nasdaq 100 (NDX) were holding above their 50-day and 200-day moving averages despite the index itself continuing to rise. Dean followed up yesterday with a different look but a similar conclusion.
The concern isn't just that fewer stocks are holding above their medium- and long-term moving averages. Maybe they're just a bit below, or maybe the averages are still rising. Those and other factors could mitigate the idea that there's a lot of damage under the surface.
One metric that can't be explained away is the number of stocks in bear markets. We use the common definition of a 20% drawdown from the most recent 52-week high as a bear market.
Oddly, more and more NDX stocks are falling into that definition. This is a change from the initial phase of the rally and is quite similar to the rally in the fall of 2021, when the index rose while more of its stocks fell into bear markets.
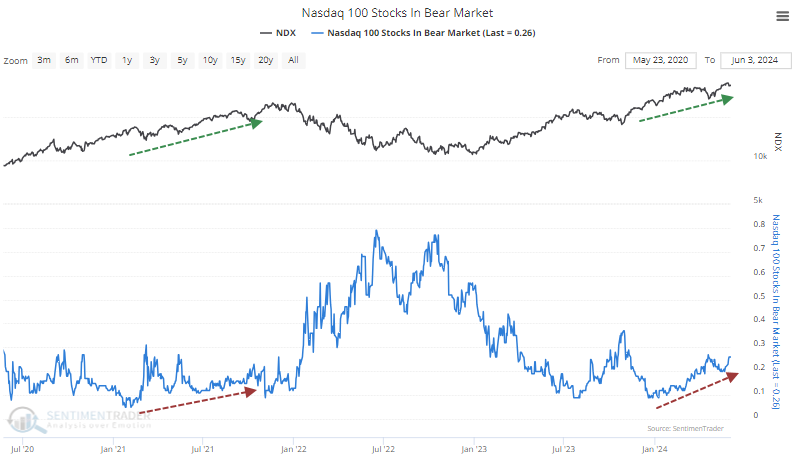
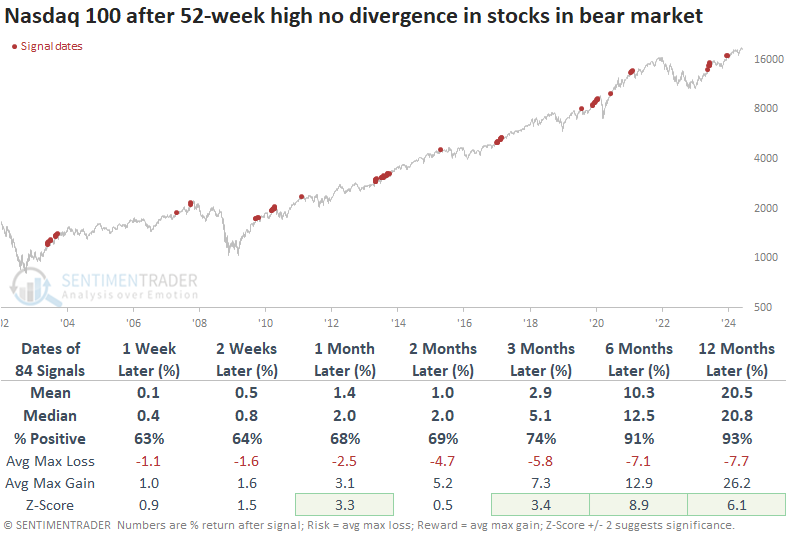
Over the past 25 years, there have been more than 100 trading days when a divergence like this has been in effect. These are days when the NDX closed at a 52-week high, yet at least 13% more stocks fell into bear markets than the lowest level over the past year. In other words, the index was rising, but more and more stocks were off more than 20% from their highs.
The summary table below shows that these were not necessarily reasons to sell tech stocks. The NDX's returns in the weeks and months ahead were fine and well above random up to six months later.
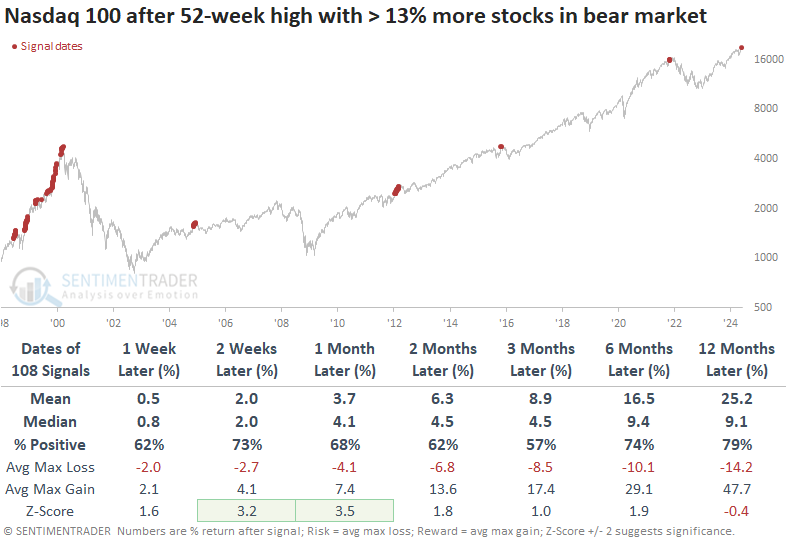
However, much of that was due to 1998-1999. During the final blow-off phase of the rally, divergences galore occurred, and the index continued to soar for months on end.
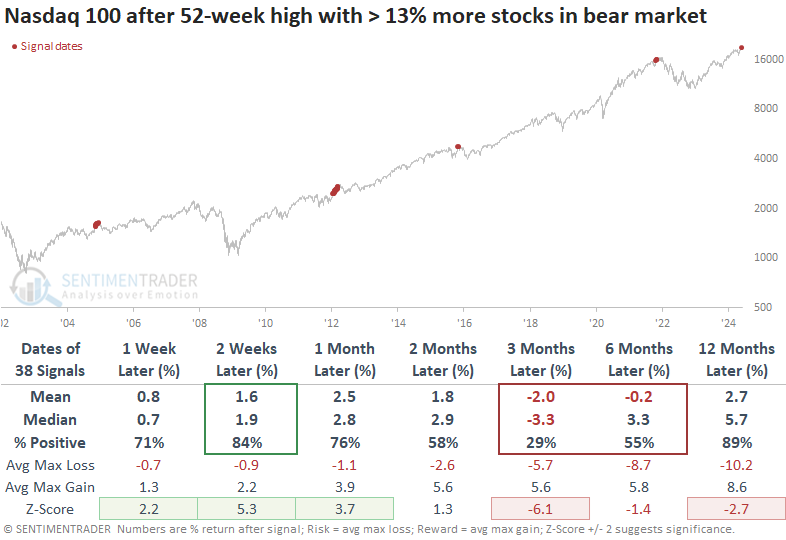
If we assume we're not on the cusp of a repeat and cut out that time frame, the table below shows a much less optimistic outlook. Even though the NDX continued to rally most of the time over the next couple of weeks, the rallies tended to sputter and showed mostly losses by three months later. The only signals that didn't show a loss were the ones from the beginning of 2012 when the NDX managed to rally for another couple of months before erasing all the gains in a subsequent correction.
The divergence signals could become more significant if forward returns are significantly different from those without divergence, as shown in the table below. Indeed, the Nasdaq 100 performed exceptionally well over the next 6-12 months when relatively few stocks were in bear markets, and the index was hitting new highs.
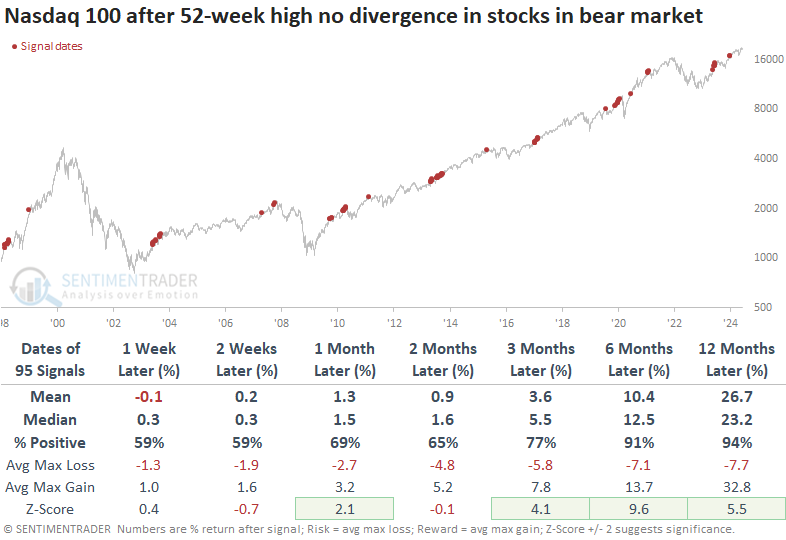
Since most of the late 1990s blow-off was accompanied by divergences, the table doesn't change much if we exclude that final bubble period.
What the research tells us...
Warning signs have been building in recent weeks, particularly on the Nasdaq and, even more notably, among the tech stocks in the Nasdaq 100. The index has been doing just fine, but participation is lagging badly. These conditions can persist for weeks or even months, but forward returns over the medium term tend to be weak by the time they've reached the current levels.
We can see that again here, with the increase in stocks falling into bear markets. This is not typical behavior when an index is reaching new highs and has been a cause for concern over the past 20 years. The late bubble years were a short-seller's nightmare because nothing mattered for more than a year and double-digit returns, so bulls have to hope that the AI hype will serve as a repeat.