Data &
Technology
Research
Reports
Report Solutions
Reports Library
Actionable
Strategies
Free
Resources
Simple Backtest Calculator
Simple Seasonality Calculator
The Kelly Criterion Calculator
Sentiment Geo Map
Public Research Reports
Free Webinar
Pricing
Company
About
Meet Our Team
In the News
Testimonials
Client Success Stories
Contact
Log inLoginSign up
< BACK TO ALL REPORTS

Monthly Anomalies You Are Probably Not Aware of (Part III)

Jay Kaeppel
2021-02-08
The first step is trading success is "spotting opportunity." Sometimes opportunities hide in plain sight.

This is Part III of a three-part series looking at unique seasonal anomalies in the stock market that most traders are not aware of.

In Part I, I looked at something of an odd "quirk" in the stock market calendar. In Part II, I highlighted a monthly 6 trading day period that has consistently witnessed poor market performance. Here in Part III, we will flip the script and highlight a monthly 4 trading day period that has consistently witnessed positive market performance.

Once again, the primary goal is simply to help investors find an edge in the markets by highlighting information that hides in plain sight.

Identifying "Trading Days"

As we did in Parts I and II, we start by counting back trading days from the end of the calendar month. As such:

  • The last trading day of the month is designated as "TDM -1"
  • The 2nd to last trading day of the month is designated as "TDM -2"
  • And so on and so forth back to TDM -4

The Period Under Consideration

For Part III the period will look at is:

  • The 4-day period each month comprised of the last 4 trading days of the month (i.e., TDM -4 through TDM -1)
  • We will look at 90 years of history from 12/31/1930 through 12/31/2020
  • The results that follow represent the hypothetical returns achieved by buying the S&P 500 Index at the close of TDM -5 every month and selling at the close on the last trading day of the month.

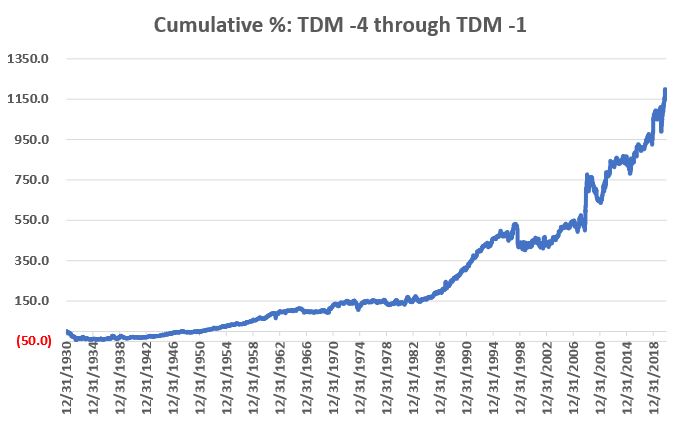
The figure below shows the cumulative % price gain for the S&P 500 Index held only during this 4-trading day period per month (i.e., the 4th to last trading day of each month through the last trading day of the month) over the full 90-year test period. The key things to note is the relatively persistent LLUR ("Lower left to upper right") nature of the equity curve.

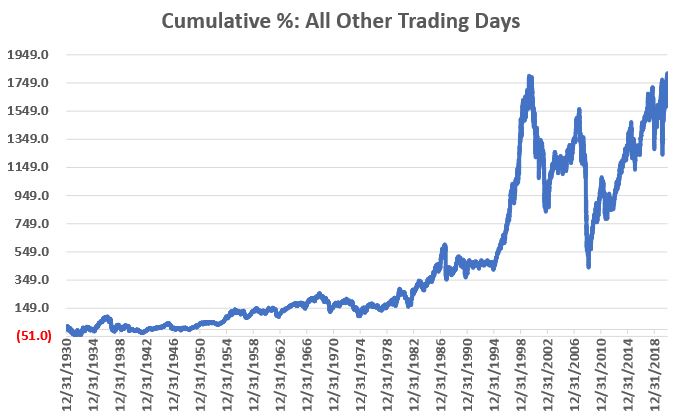
For comparison sake, let's look at the cumulative % price gain for All Other Trading Days (i.e., every day of every month NOT including the last 4 trading days of the month). In the chart below we see a higher overall gain than in the previous chart. This should not be surprising since the last 4 days of the month comprise only 18.3% of all trading days (All Other Trading Days depicted in the chart below comprise 81.7% of all trading days). But note the violent swings that mark the equity curve below.

To compare consistency let's look at 10-year rolling returns for:

  • Last 4 trading days of the month
  • All Other Trading Days
  • Buying-and-Holding the S&P 500 Index

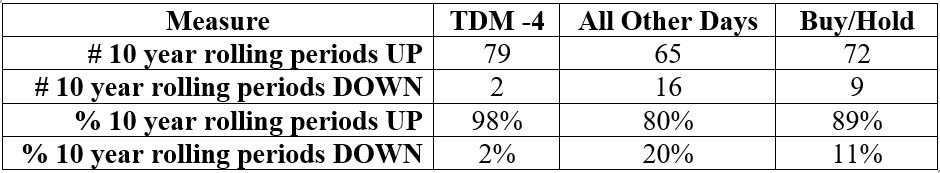
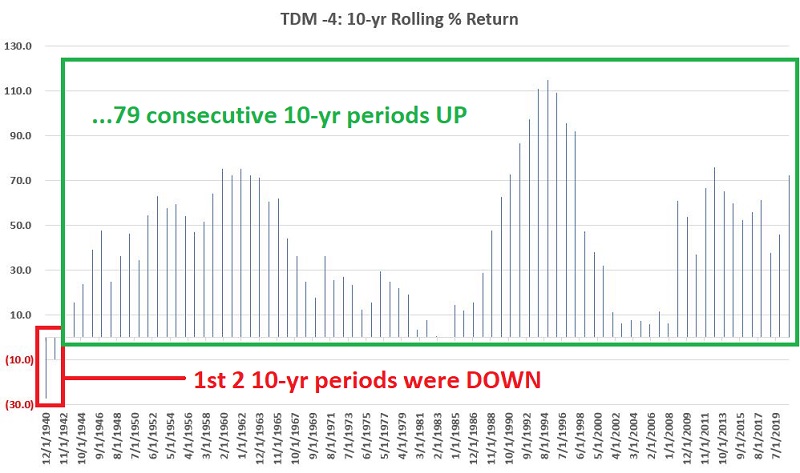
The key thing to note is that buying and holding only during TDM -4 to TDM -1 registered a 10-year rolling gain 98% of the time. 

Interestingly - and as you can see in the chart below - the two losing 10-year rolling periods for TDM -4 were the first two measured (Dec-1930 to Dec-1940 and Dec-1931 to Dec-1941). Since then, the last 79 consecutive 10-year periods have witnessed an overall gain for the S&P 500 Index during TDM -4 to TDM -1.


Sorry, you don't have access to this report

Upgrade your subscription plan to get access
Go to Dasboard
DATA &
TECHnologies
IndicatorEdge
‍
BackTestEdge
‍
Other Tools
‍
DataEdge API
RESEARCH
reports
Research Solution
‍
Reports Library
‍
actionable
Strategies
Trading Strategies
‍
Smart Stock Scanner
‍
FREE
RESOUrCES
Simple Backtest
Calculator
Simple Seasonality
Calculator
The Kelly Criterion
Calculator
Sentiment Geo Map
‍
Public Research Reports
‍
Free Webinar
COMPANY
‍
About
‍
Meet our Team
‍
In the News
‍
Testimonials
‍
Client Success Stories
Pricing
Bundle pricing
‍
Announcements
‍
FAQ
© 2024 Sundial Capital Research Inc. All rights reserved.
Setsail Marketing
TermsPrivacyAffiliate Program
Risk Disclosure: Futures and forex trading contains substantial risk and is not for every investor. An investor could potentially lose all or more than the initial investment. Risk capital is money that can be lost without jeopardizing ones’ financial security or life style. Only risk capital should be used for trading and only those with sufficient risk capital should consider trading. Past performance is not necessarily indicative of future results.

Hypothetical Performance Disclosure: Hypothetical performance results have many inherent limitations, some of which are described below. No representation is being made that any account will or is likely to achieve profits or losses similar to those shown; in fact, there are frequently sharp differences between hypothetical performance results and the actual results subsequently achieved by any particular trading program. One of the limitations of hypothetical performance results is that they are generally prepared with the benefit of hindsight. In addition, hypothetical trading does not involve financial risk, and no hypothetical trading record can completely account for the impact of financial risk of actual trading. for example, the ability to withstand losses or to adhere to a particular trading program in spite of trading losses are material points which can also adversely affect actual trading results. There are numerous other factors related to the markets in general or to the implementation of any specific trading program which cannot be fully accounted for in the preparation of hypothetical performance results and all which can adversely affect trading results.

Testimonial Disclosure: Testimonials appearing on this website may not be representative of other clients or customers and is not a guarantee of future performance or success.