Data &
Technology
Research
Reports
Report Solutions
Reports Library
Actionable
Strategies
Free
Resources
Simple Backtest Calculator
Simple Seasonality Calculator
The Kelly Criterion Calculator
Sentiment Geo Map
Public Research Reports
Free Webinar
Pricing
Company
About
Meet Our Team
In the News
Testimonials
Client Success Stories
Contact
Log inLoginSign up
< BACK TO ALL REPORTS

Monday Midday Color

Jason Goepfert
2019-03-04
null

Here's what's piquing my interest so far today.
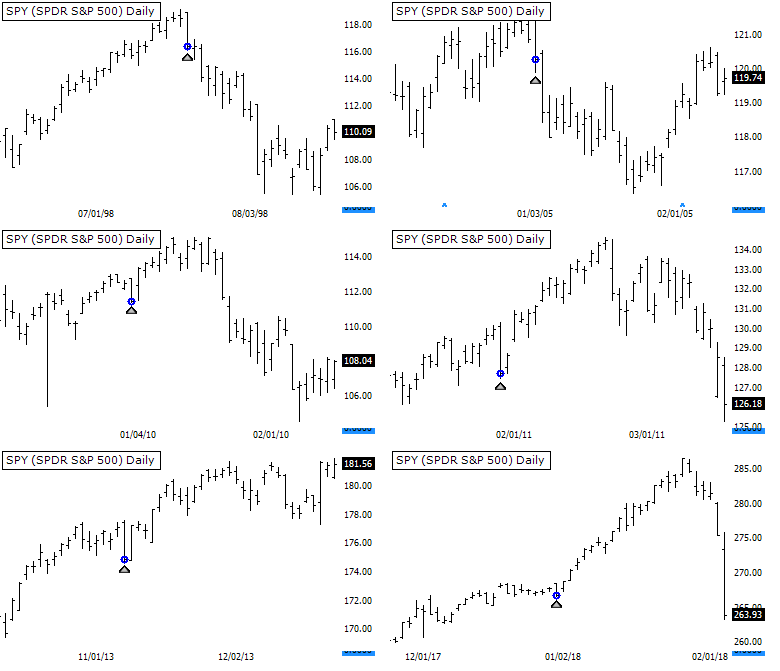
Reversal

Pretty nasty-looking outside reversal in indexes and funds like SPY today. But...be careful. These have a terrible habit of not working like chartists insist they should. Following is every time SPY gapped up above the highest close in the past 50 days and then reversed to close at the lowest point in at least the past week. Two of them, in 1998 and 2005, did lead to more sustained downside. But the four since then preceded immediate upside reversals.
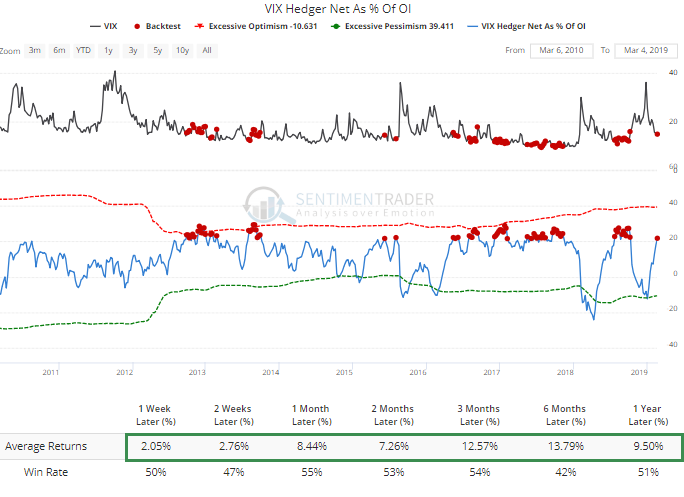
Volatility

Hedgers have been stepping up their purchases of VIX futures. As of mid-February, they were holding more than 20% of the open interest in those contracts net long. When hedgers held this much of the open interest, the VIX's tendency to rise was middling, but its returns were skewed to the upside. That's not all that surprising given volatility's behavior, but is a minor suggestion that the rapid drop in the VIX may start to slow.
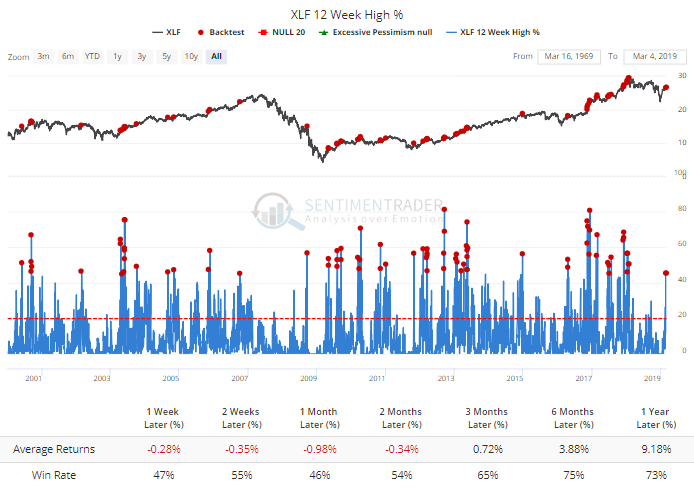
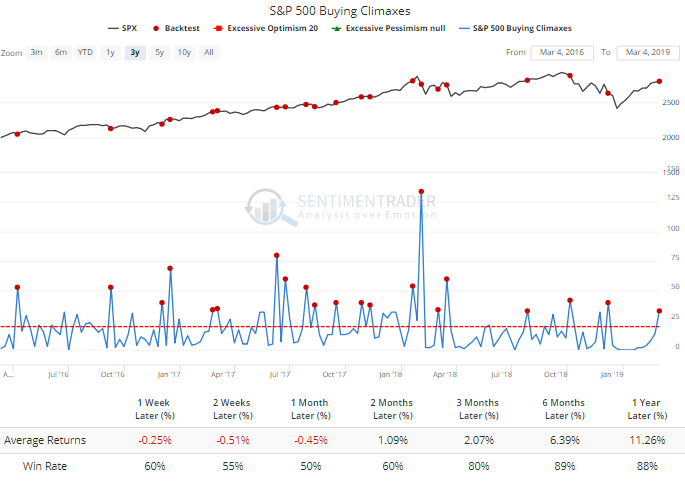
Buying Exhaustion

After the record-setting number of selling climaxes in December, we haven't seen any weeks with a large number of either buying or selling climaxes. Last week, buying climaxes finally increased to the highest level since early December. Out of the 505 stocks in the S&P 500, 33 of them set a 52-wee high during the week, then reversed to close below the prior week's close.

This is not at all extreme, and buying climaxes are less reliable than selling climaxes. The only caution is that over the past few years, buying climaxes this numerous led to below-average returns over the shorter-term.
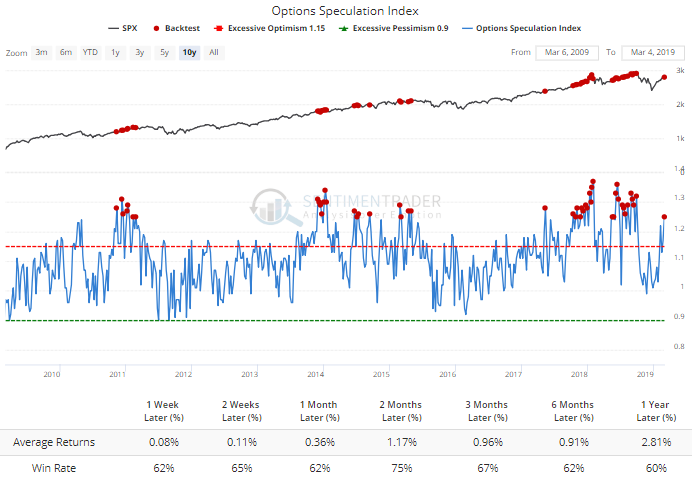
Bullish Traders

Options traders have become significantly more aggressive in recent weeks. Last week, the volume of bullish options strategies was 25% heavier than bearish ones, the most since last September. Again, this has not led to particularly negative returns in stocks, but those returns were definitely "meh." Even three months later, the S&P's average return was less than 1%, during one of the most impressive bull markets in history.

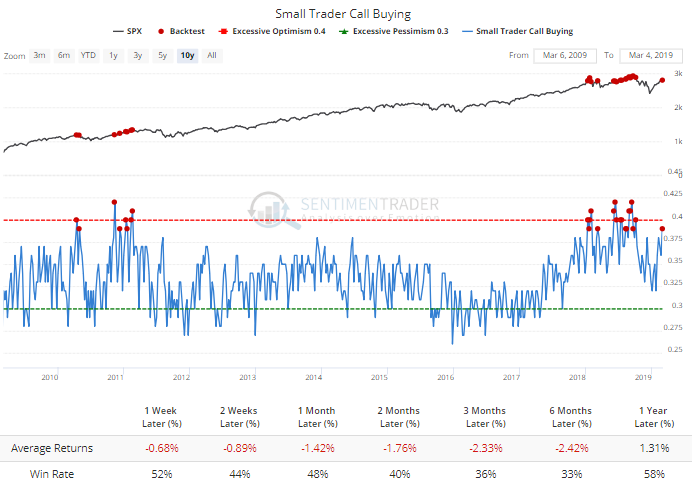
A large part of the jump in speculative options activity was due to the smallest of traders. Those folks spent 39% of their volume on purchasing call options. While their put activity is still higher than normal, when they've focused so much of their activity on calls, stocks have struggled.
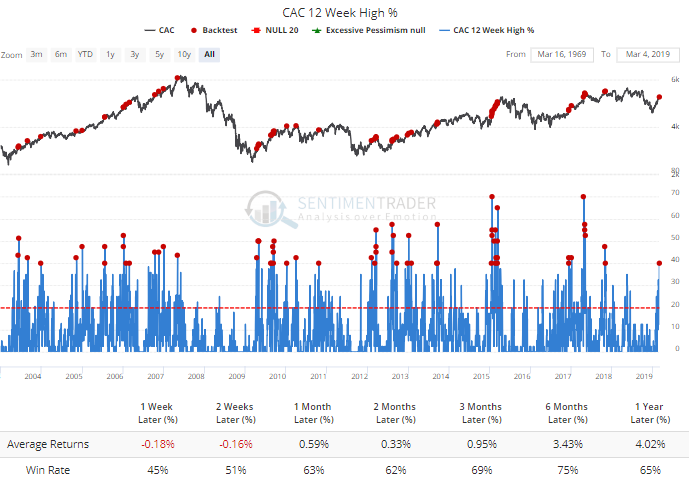
Breadth Extremes

The moves on Friday triggered a couple more extremes in sector breadth. Most notably, a jump in French stocks hitting multi-month highs. This has led to modest under-performance short-term.

Same for financials.


Sorry, you don't have access to this report

Upgrade your subscription plan to get access
Go to Dasboard
DATA &
TECHnologies
IndicatorEdge
‍
BackTestEdge
‍
Other Tools
‍
DataEdge API
RESEARCH
reports
Research Solution
‍
Reports Library
‍
actionable
Strategies
Trading Strategies
‍
Smart Stock Scanner
‍
FREE
RESOUrCES
Simple Backtest
Calculator
Simple Seasonality
Calculator
The Kelly Criterion
Calculator
Sentiment Geo Map
‍
Public Research Reports
‍
Free Webinar
COMPANY
‍
About
‍
Meet our Team
‍
In the News
‍
Testimonials
‍
Client Success Stories
Pricing
Bundle pricing
‍
Announcements
‍
FAQ
© 2024 Sundial Capital Research Inc. All rights reserved.
Setsail Marketing
TermsPrivacyAffiliate Program
Risk Disclosure: Futures and forex trading contains substantial risk and is not for every investor. An investor could potentially lose all or more than the initial investment. Risk capital is money that can be lost without jeopardizing ones’ financial security or life style. Only risk capital should be used for trading and only those with sufficient risk capital should consider trading. Past performance is not necessarily indicative of future results.

Hypothetical Performance Disclosure: Hypothetical performance results have many inherent limitations, some of which are described below. No representation is being made that any account will or is likely to achieve profits or losses similar to those shown; in fact, there are frequently sharp differences between hypothetical performance results and the actual results subsequently achieved by any particular trading program. One of the limitations of hypothetical performance results is that they are generally prepared with the benefit of hindsight. In addition, hypothetical trading does not involve financial risk, and no hypothetical trading record can completely account for the impact of financial risk of actual trading. for example, the ability to withstand losses or to adhere to a particular trading program in spite of trading losses are material points which can also adversely affect actual trading results. There are numerous other factors related to the markets in general or to the implementation of any specific trading program which cannot be fully accounted for in the preparation of hypothetical performance results and all which can adversely affect trading results.

Testimonial Disclosure: Testimonials appearing on this website may not be representative of other clients or customers and is not a guarantee of future performance or success.