Monday Midday Color

Here's what's piquing my interest so far on this rally-fading day.
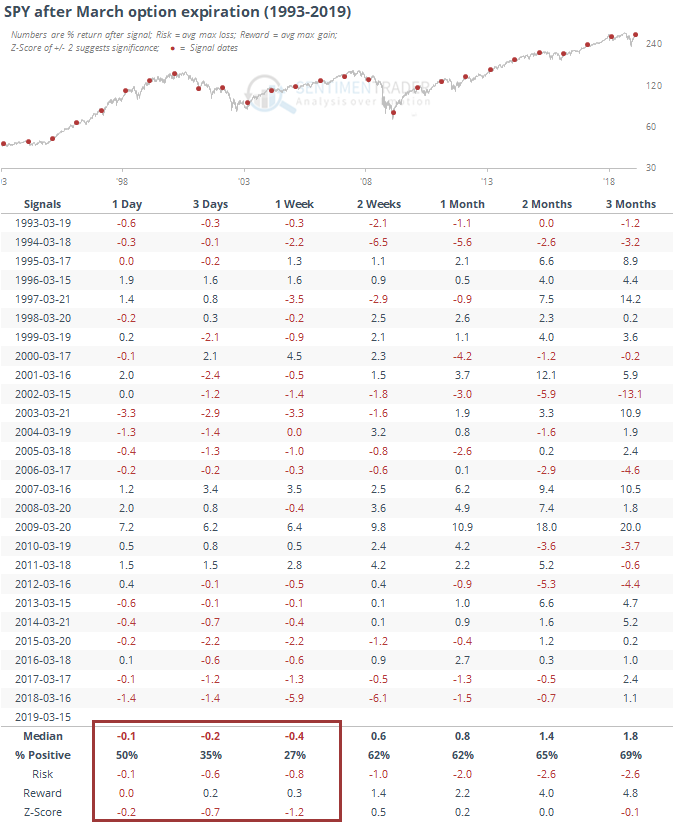
Expiration
I think we've been looking at this tendency for more than 15 years now, and surely others were before that. After one of the quadruple witching days, especially in March, stocks have struggled for the next week. Not sure if that has to do with options activity or just a quirk of seasonality, but SPY has lost ground following March opex for the past 7 years.
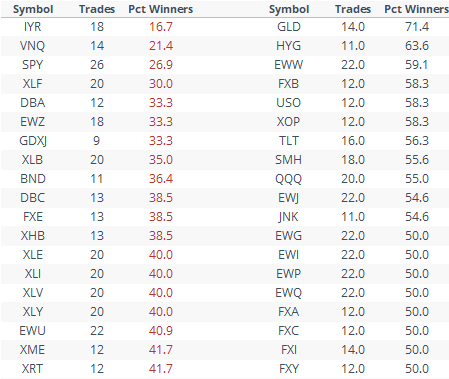
Among the most popular ETFs we follow, SPY was among the most consistent decliners. Real estate funds were the weakest. Gold and junk bonds were the most consistent gainers during this week.
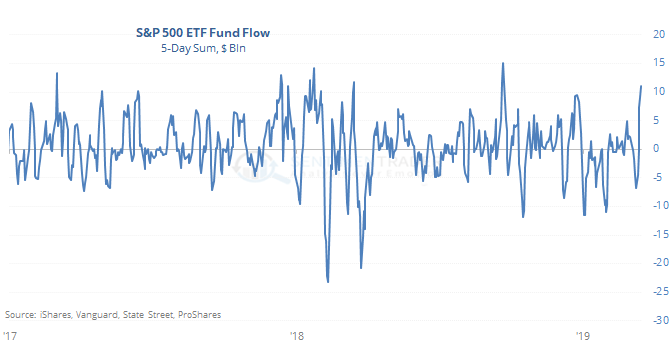
Flow
There was a major inflow to equity ETFs last week, the largest in a couple of years. Others led to at least short-term plateaus.
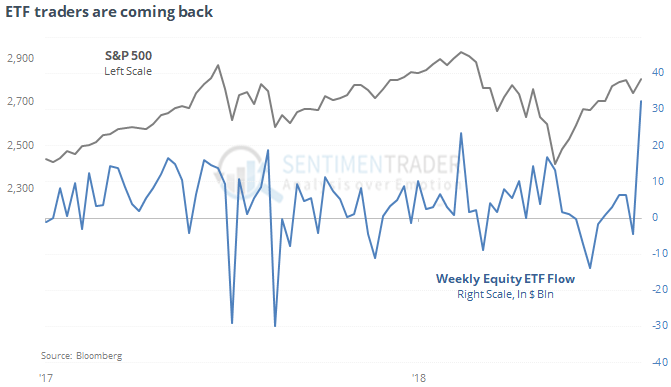
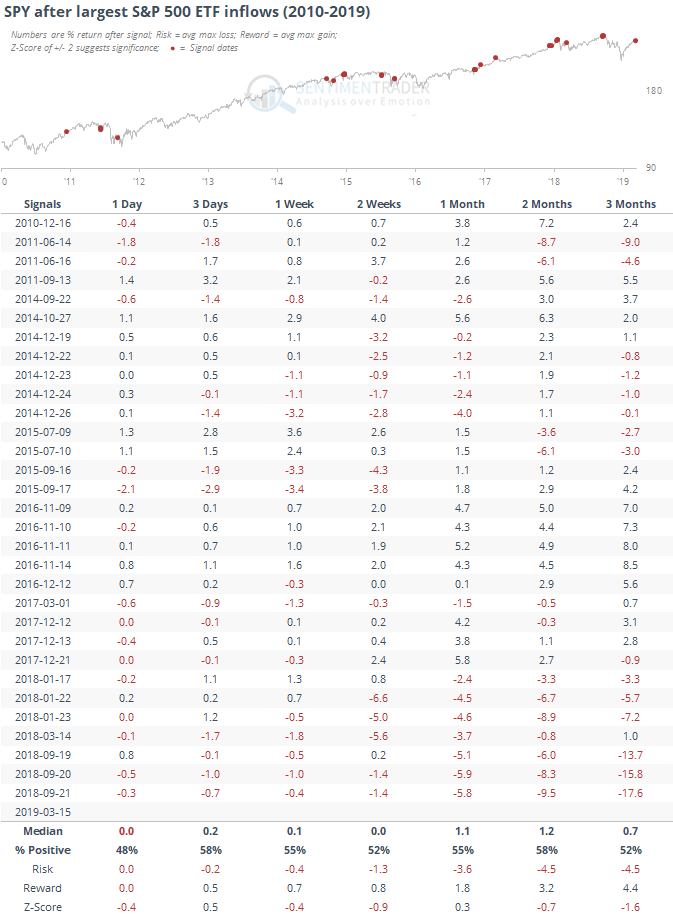
Much of the inflow was to S&P 500 funds, which took in more than $11 billion for the week.
That's among the larger flows since 2010. It's not like other big flows were a disaster, but SPY did struggle a bit over the next couple of weeks, with more risk than reward. Out of the 31 dates, 25 of them showed a negative return at some point over the next two weeks.
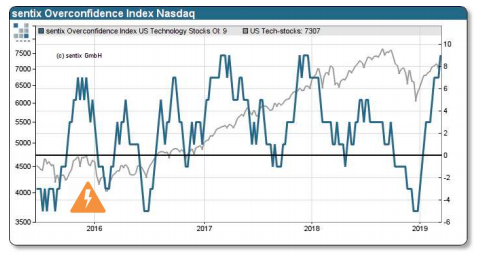
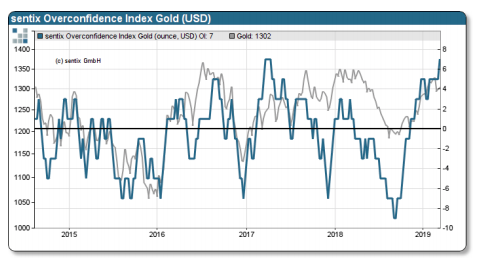
Overconfidence
The German surveying firm Sentix shows that there has been a marked increase in sentiment on both the Nasdaq and gold markets. Both have a decent record at highlighting conditions of higher risk for the shorter-term.
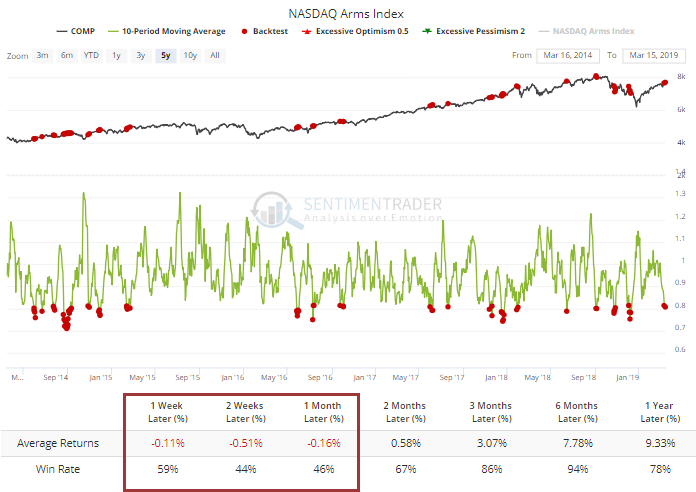
Speaking of the Nasdaq, the 10-day average of the Arms Index (TRIN) is at a very low level, showing that volume has been flowing inordinately into rising stocks. It's at a point that has indicated at least a slight condition of too-much-too-fast over the past five years (h/t Helene Meisler).
Ag
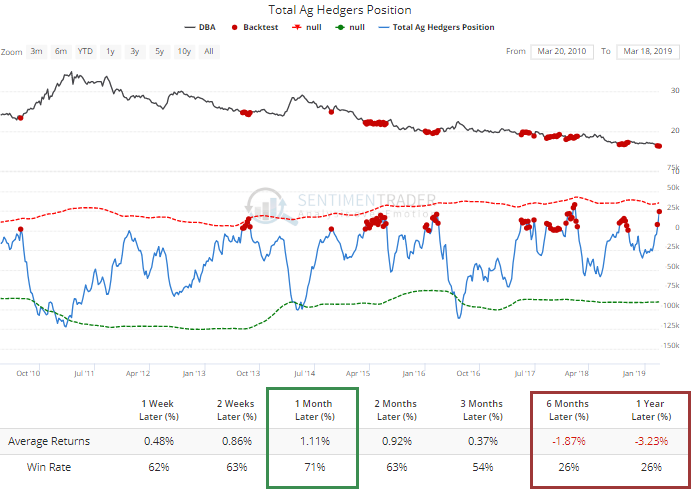
After what's been an absolutely horrid stretch, "smart money" traders have placed a large bet on agricultural futures contracts. They are now net long more than 20,000 contracts in the ones that make up the DBA exchange-traded fund. That ranks among the largest positions ever. The only other times it got about this large, DBA rallied in the weeks and months ahead.
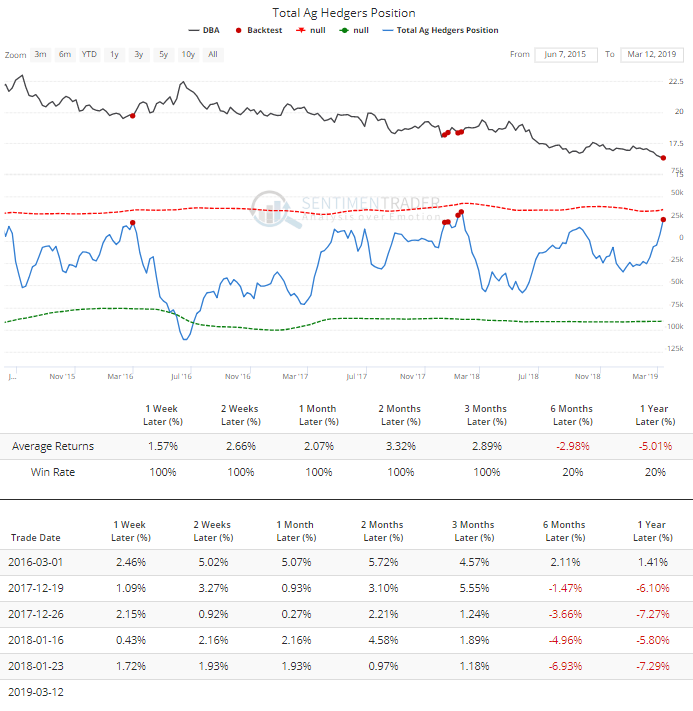
Any time hedgers have been net long these contracts, DBA has tended to do much better than a random time. That's saying something for a fund that has been in an almost relentless decline for 8 years.
Momentum
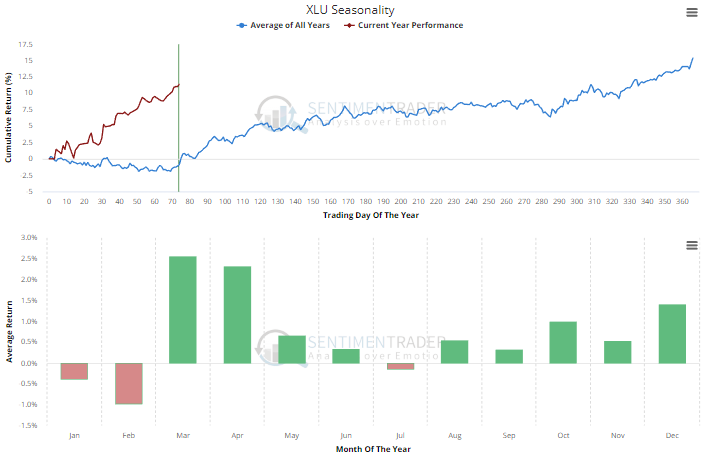
The prolonged momentum underlying some sectors has reached nosebleed levels. For a staid sector like utilities, we have rarely seen a time when the McClellan Summation Index can hold at this high of a level. Almost always, any further short-term gains are given back at some point over the next 1-2 months.
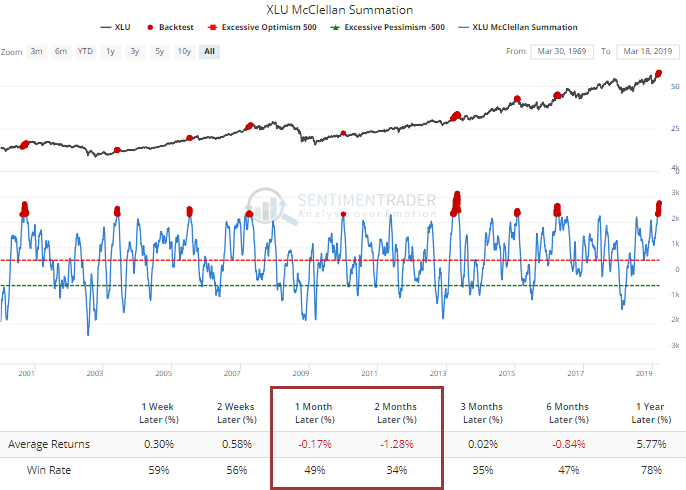
The few times it got above 2500, the 2-month returns in XLU were even worse.
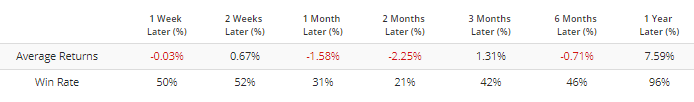
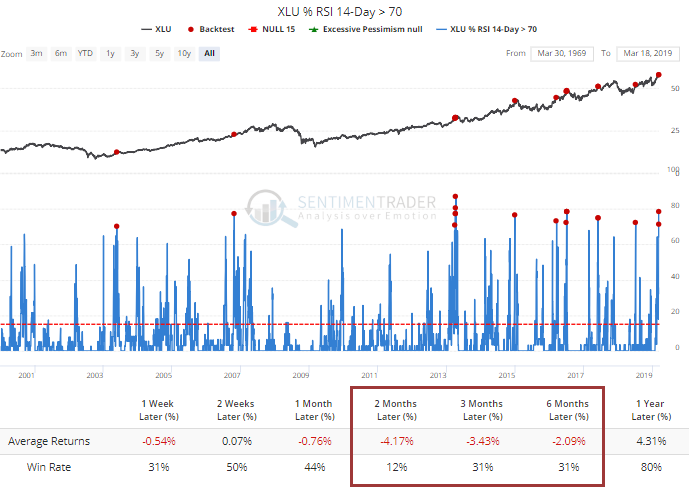
It's also rare to see the typically slow-moving sector have more than 70% of its component stocks in overbought territory at the same time. Almost every time, that led to a negative return over the next two months.
Utilities have typically performed very well in March and April, with the seasonal pattern pointing up at an almost 45-degree angle. But seasonality is a tertiary factor at best in stocks, and besides, it has done pretty much the opposite of its usual pattern so far this year.