
Monday Color - Small traders, dollar sellers, S&P momentum, quarterly run, energy bonds

Here's what's piquing my interest during what should be a slow stretch, with a confluence of religious and national holidays on tap.
Small Traders
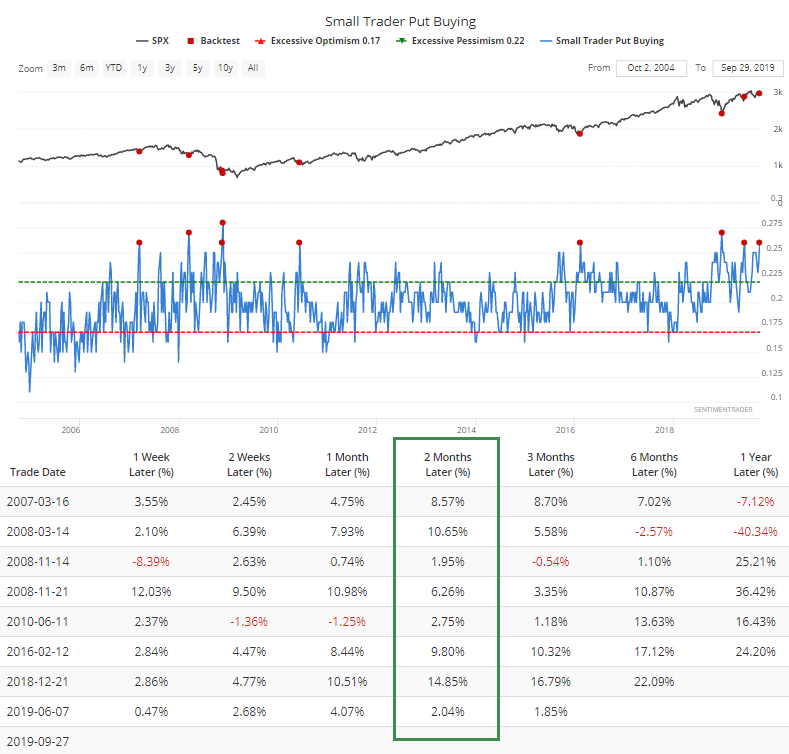
The smallest of options traders are at it again. Last week, they were unnerved enough that they spent 26% of their total volume on buying protective put options. Over the past 15 years, that ranks among the highest levels.
Two months after the other weeks with such heavy put buying, the S&P 500 was higher each time.
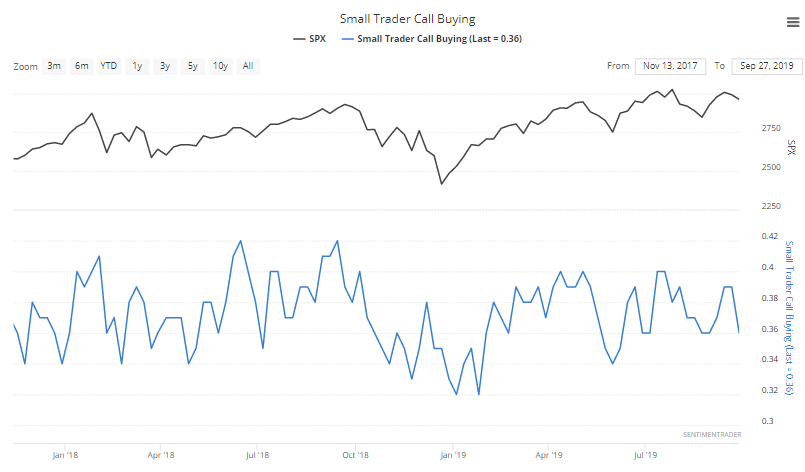
Their call buying ticked lower, which is a good sign, but it's still not as low as it was, say, last December, or even in June, the last couple of times their put buying was so heavy.
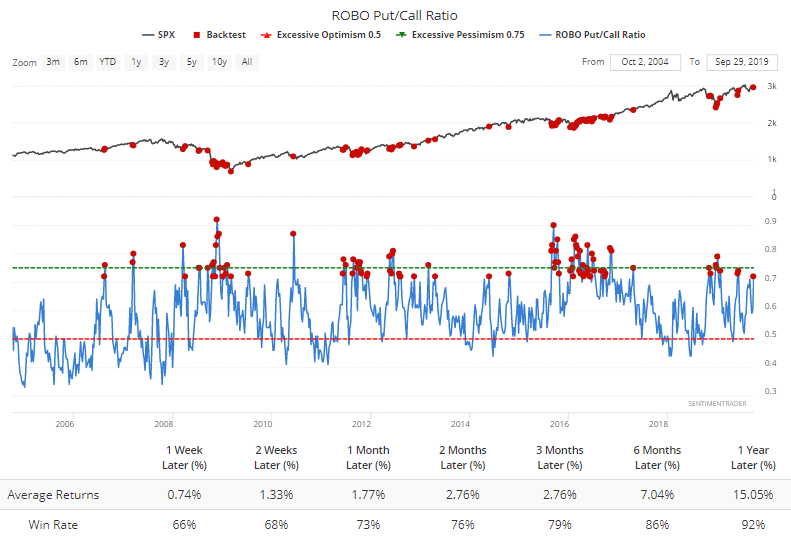
The ROBO Put/Call Ratio combines these two, and shows heavy pessimism overall, with good returns for stocks going forward.
They've also been paying up for the right to buy those puts. The premiums they're paying on puts relative to calls has spiked to a high level, especially since the end of the financial crisis.
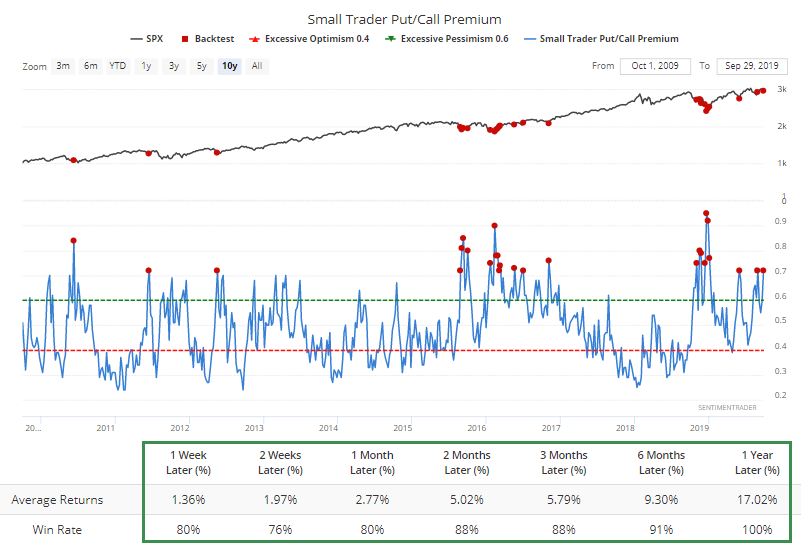
During a bear market, this can (and does) climb much higher, so this is dependent on a relatively healthy market environment. This is one of the most positive of all the indicators we follow.
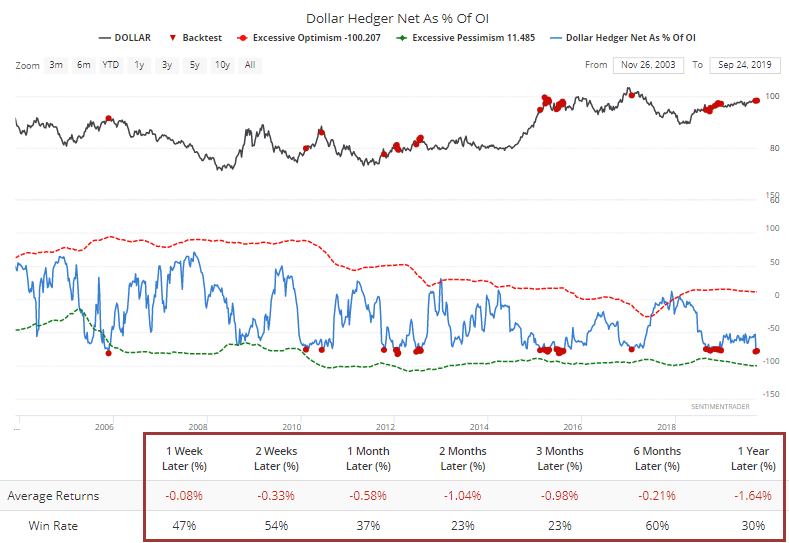
Smart Money Selling Dollar
Commercial hedgers in the U.S. dollar sold heavily last week. At the same time, open interest in dollar futures has been dropping, so as a percentage of open interest, their position looks especially concerning. They're holding more than 75% of interest in dollar futures net short.
The buck has stumbled after other times they held this large of a position against it.
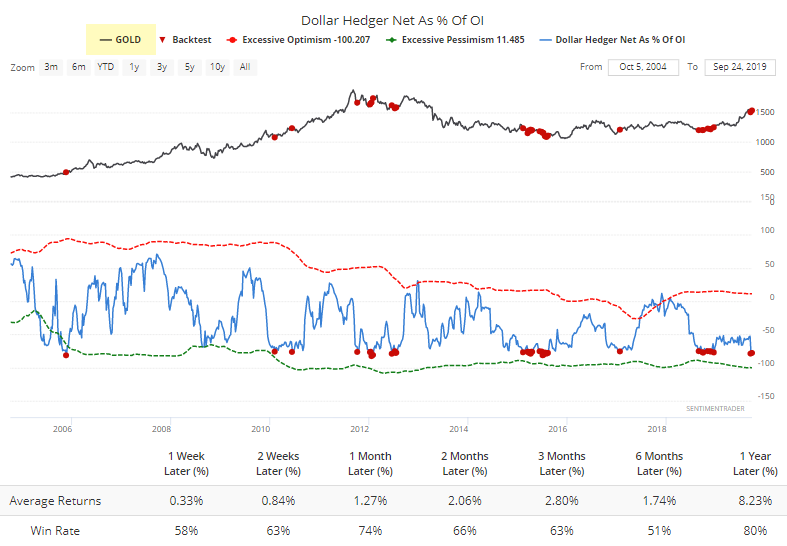
What's bad for the dollar is usually good for assets like gold. Most of what we've looked at lately for gold has been negative, but this is one that has usually led to good (not great) returns for the metal. Clearly not helping today, though.
Quite A Run
Stocks have been on a hot streak, with the S&P 500 on track to close September with a positive return over the past 1, 3, 6, and 12 months. Under similar scenarios, the last day of the month itself has been curiously weak, but it didn't tend to last long.
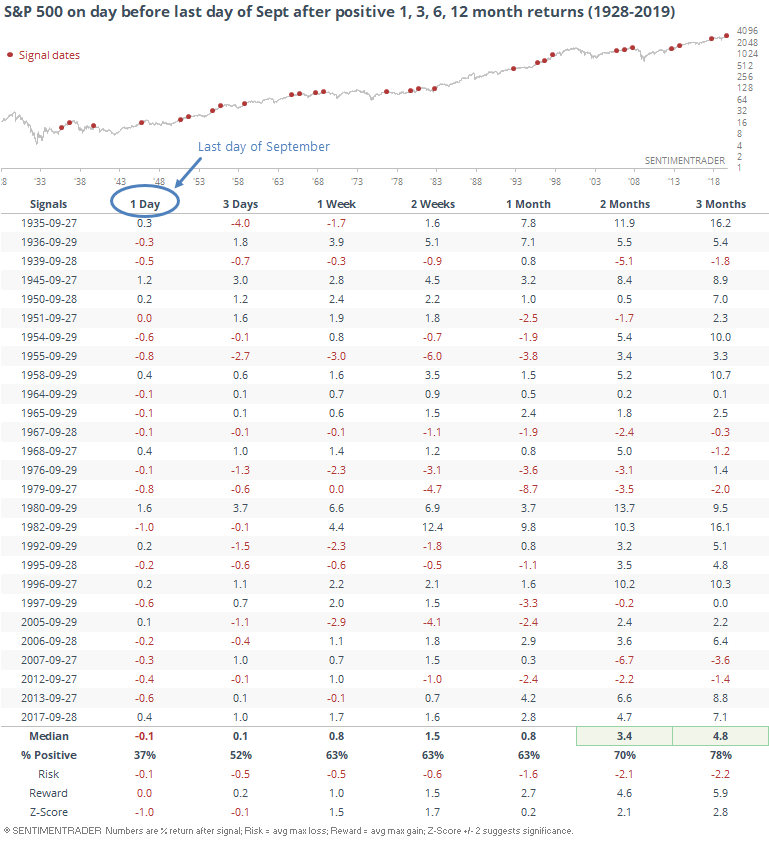
If we simply waited a day (buying the S&P at the close today, for example), returns perked up significantly in the shorter-term.
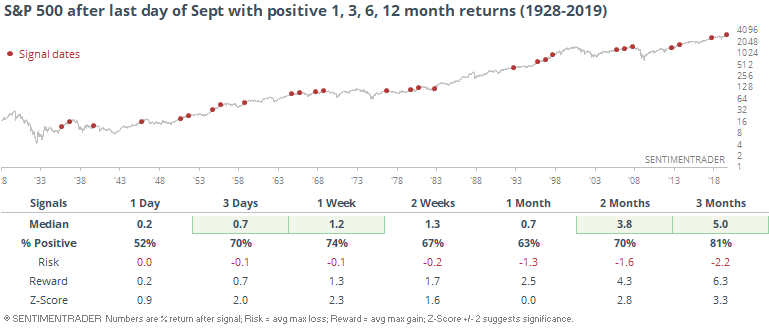
In the tables above, returns over the next month were a little bit weak, or at least quite a bit weaker than the returns over the next 2-3 months. That suggests that there is sometimes some rough sailing in October.
Unless stocks fall out of bed today, then the S&P will also have enjoyed 3 straight positive quarters for the year, with a total gain over 15%.
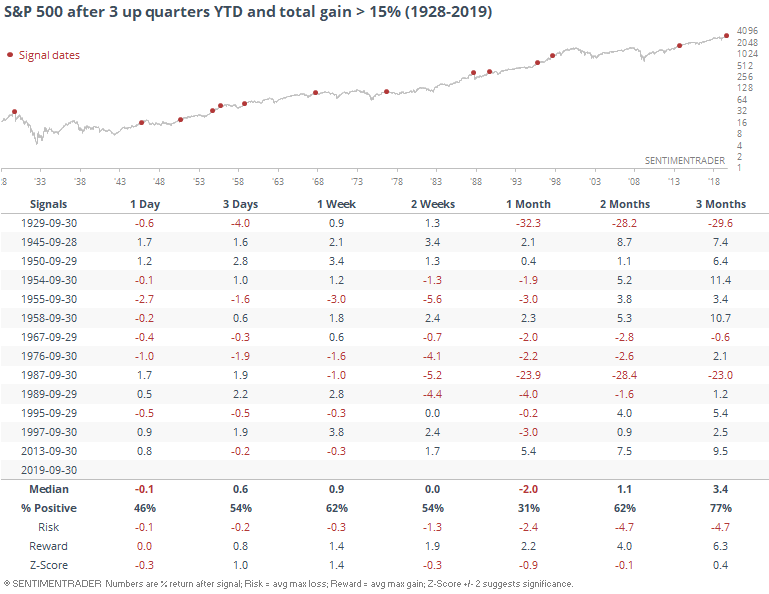
Other years that have enjoyed these kinds of gains into the fall have experienced rocky returns over the next month as well.
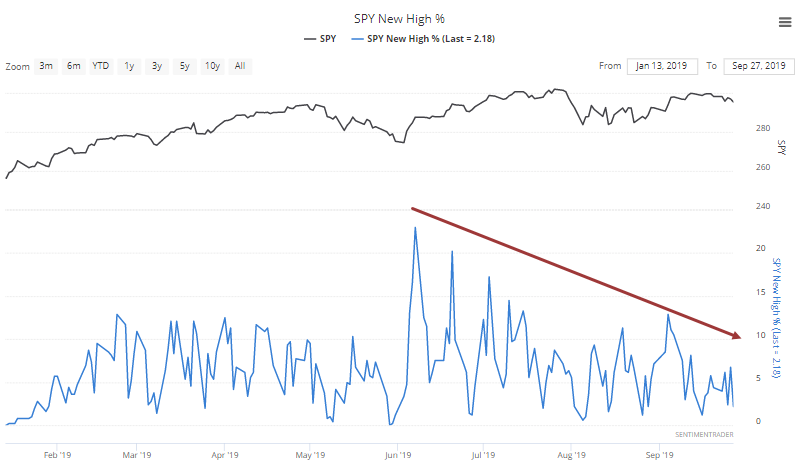
New High Divergence
The WSJ notes that a reason for caution here is due to a troubling divergence underlying the S&P 500's recent run at new highs. While the index nearly eclipsed its old high, fewer and fewer of its stocks were also able to do so.
Divergences are iffy things, and don't often (or even usually) pan out like theory suggests. This is one of the main issues with technical analysis that's taught in textbooks and certification courses - most of it is made up because it sounds good or worked decades ago. Much of fundamental analysis suffers from the same issues.
Anyway, below we can see how well it worked to become cautious because of a divergence like this. The table below shows every time the S&P came to within 0.55% of a new high, which it did a couple of weeks ago, but fewer than 10% of its members were hitting a new high at the time, and that was down by at least half from some point in the past three months (a glaring negative divergence).
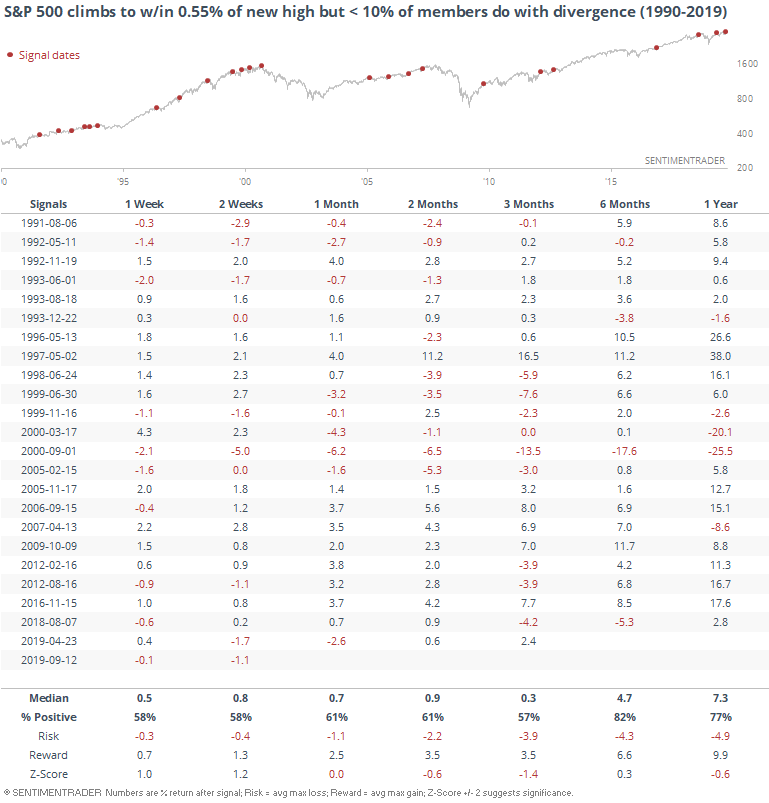
Its returns going forward weren't great, with a negative z-score over the next 3 months, but it was still positive most of the time. And its returns over the next 6 months were consistently positive.
If the S&P manages to reach a new high in the coming days, and the percentage of its member stocks also hitting a new high is extremely low, like under 5%, then we'd have more of an issue. Right now, not so much.
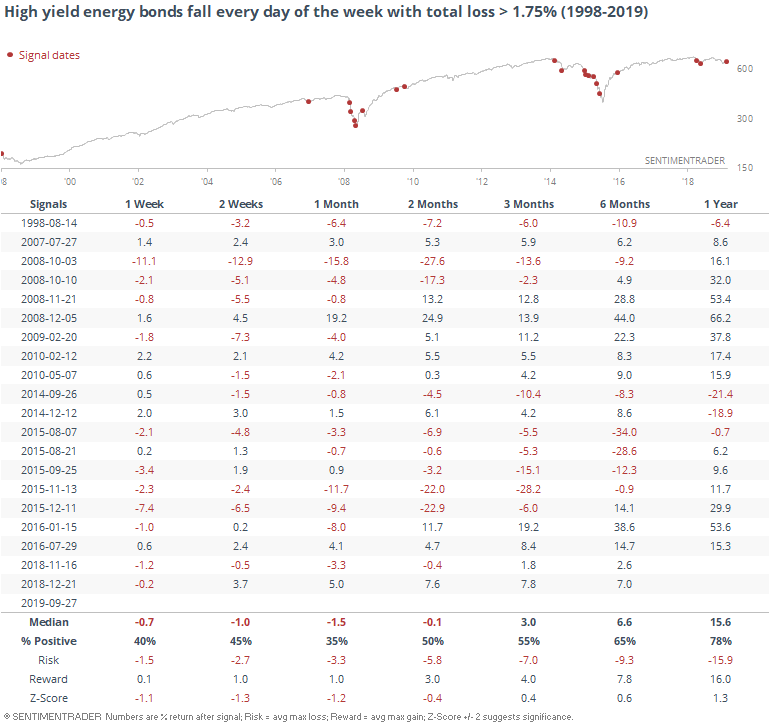
Losing Energy
Luke Kawa of Bloomberg tweets that junk bonds in the energy sector had a very bad week last week. Every day of the week saw a loss, with a total drop of more than 1.75%.
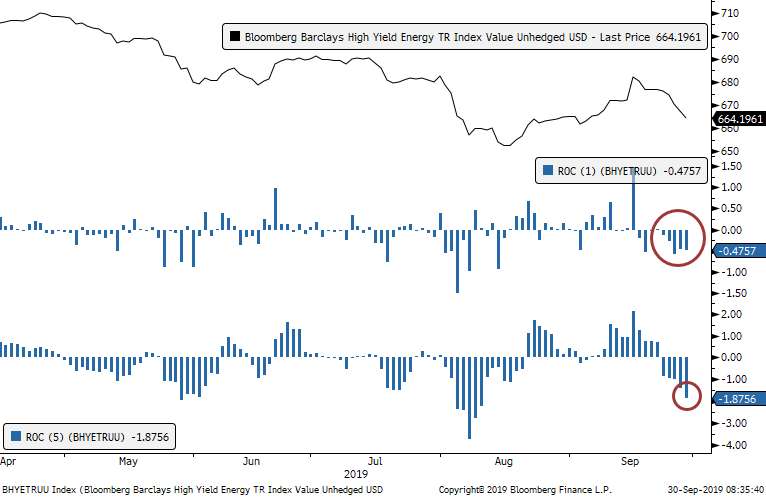
Other times the Bloomberg Barclays index of these bonds suffered similar drops, the bonds tended to keep sliding, mainly because it mostly triggered during the last two protracted bear markets for the sector.
Interestingly, it wasn't that bad of a sign for energy stocks.
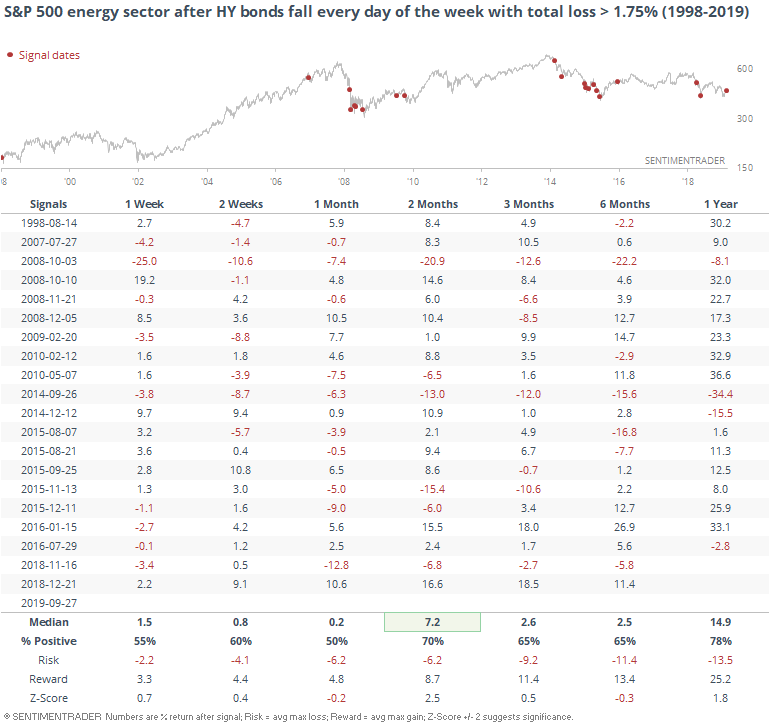
Usually when there are moves like this in the bond market, it's worse for the stocks going forward than the bonds, but this one is flipped.