Monday Color - Short-Term Optimism, Funds Vs Options, Lagging Small Caps And Surprises, Bulls Return, Bonds

Here's what's piquing my interest as markets suffer their usual post-holiday slide.
Short-Term Extremes
While stocks didn't surge last week, they did hold their gains. And whoever was still trading over a holiday week was pretty optimistic it was going to continue.
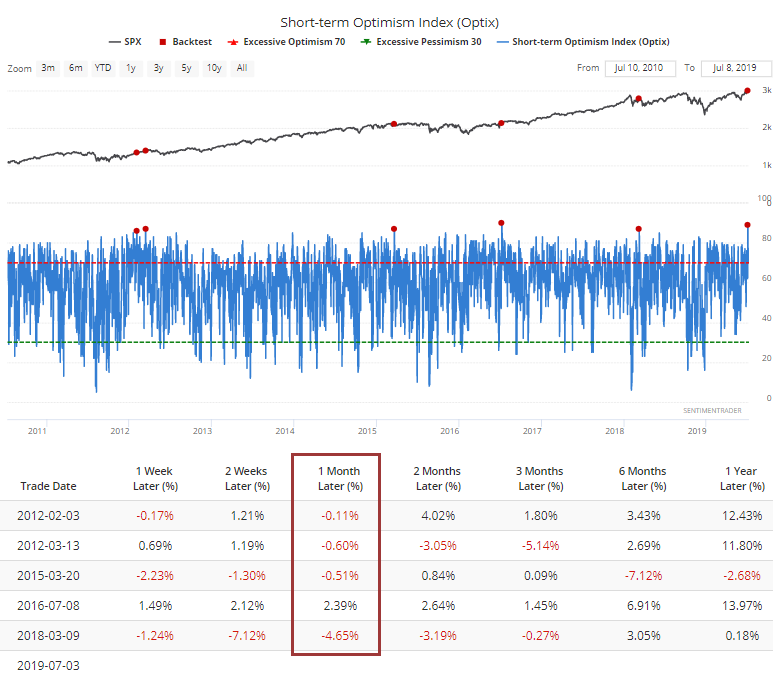
The shortest-term indicators we follow moved to one of the most-stretched readings we've ever seen on Wednesday, and it dipped only a moderate amount on Friday. Since the end of the financial crisis, Short-Term Optimism Index readings above 85 have been rare, and all but one led to some kind of plateau. Even the one that showed a gain barely kept its positive return over the next few months.
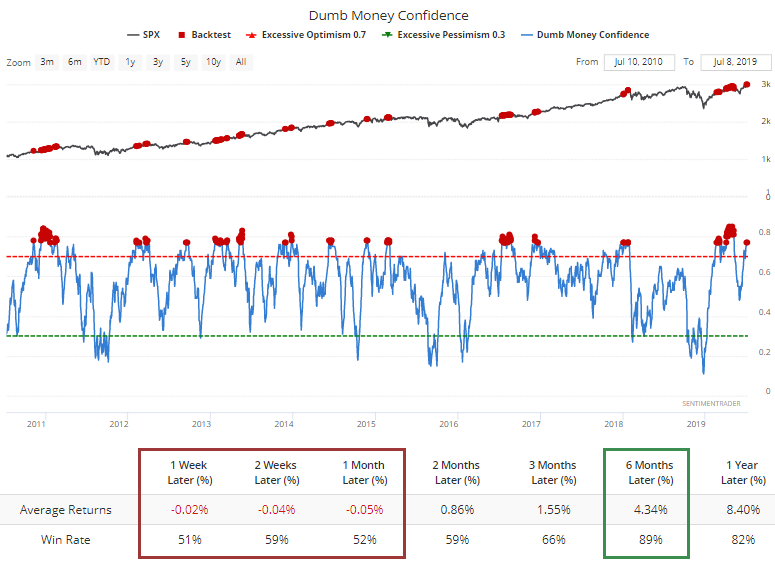
That has also led to a jump in Dumb Money Confidence, now above 77% for the first time since May. Not necessarily a rally-killer, but shorter-term returns have been negative after such high readings.
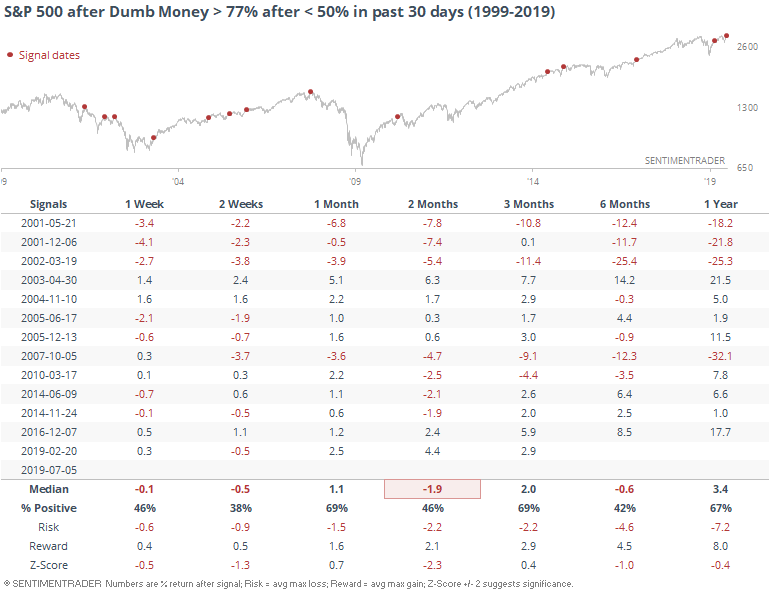
If we focus on the first reading this high in at least 30 days, after Confidence had been below 50% at some point, returns were still questionable.
Flow
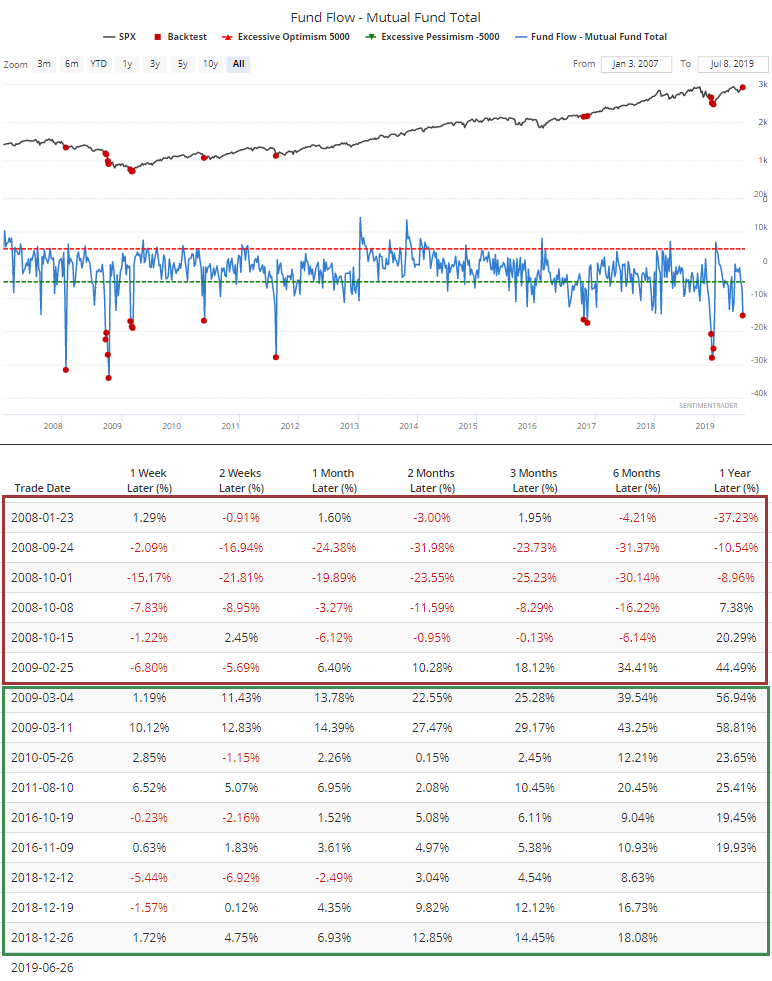
The biggest knock against the "excessive optimism" argument is probably fund flows. Especially when it comes to mutual funds, equity investors continue to yank money out of stocks. According to the ICI, near the end of June, investors pulled more than $15 billion from equities, one of the most in over a decade.
During the financial crisis, and again near the end of 2018, that didn't prevent some large-scale selling pressure. Outside of that, it was a rare - and positive - sing of capitulation.
The knock against relying too heavily on this as a positive is that the same trend is NOT being seen in ETF flows where the past few weeks have seen relatively large inflows to equity funds.
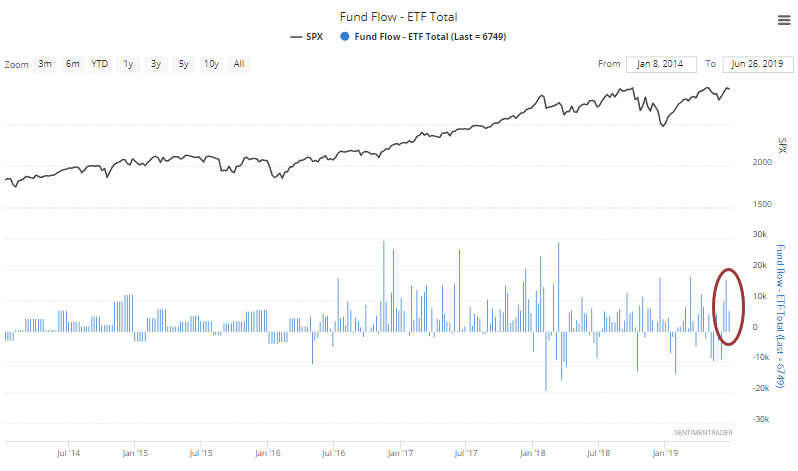
Overall, it's probably something of a wash, maybe with a slight positive bias.
Options Traders
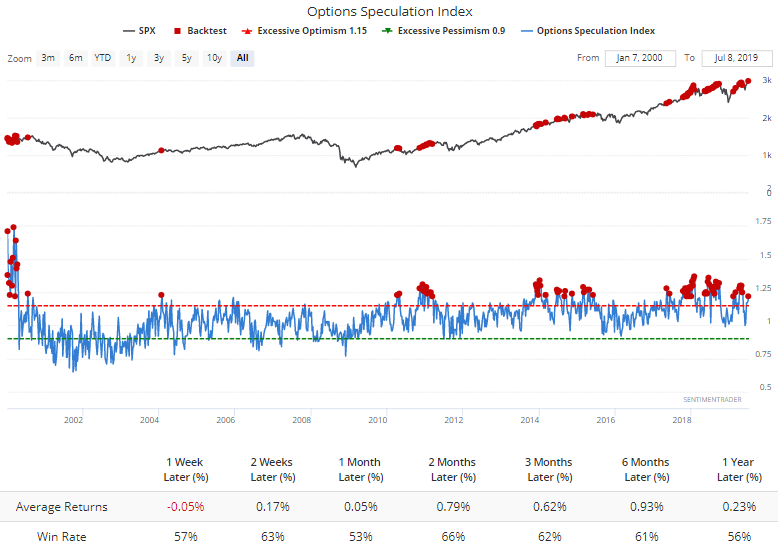
Unlike fund flows, options traders aren't showing much hesitation. The Options Speculation Index rose above 1.22, meaning that bullish options strategies outnumbered bearish strategies by 22% last week. It got much higher at various points in 2017-18, but historically this is high enough to be considered extreme.
The S&P's returns after readings this high were flat.
Lagging Small-Caps
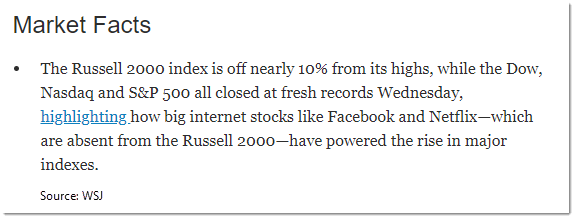
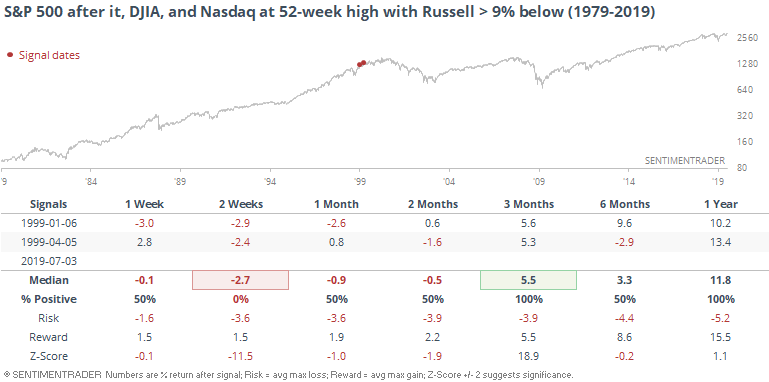
The WSJ notes that while the S&P 500, Dow Industrials, and Nasdaq Composite all made new highs, the small-cap Russell 2000 has been lagging badly.
This is highly atypical. Since all four indexes have come into existence, it's only triggered twice before, in January and April 1999.
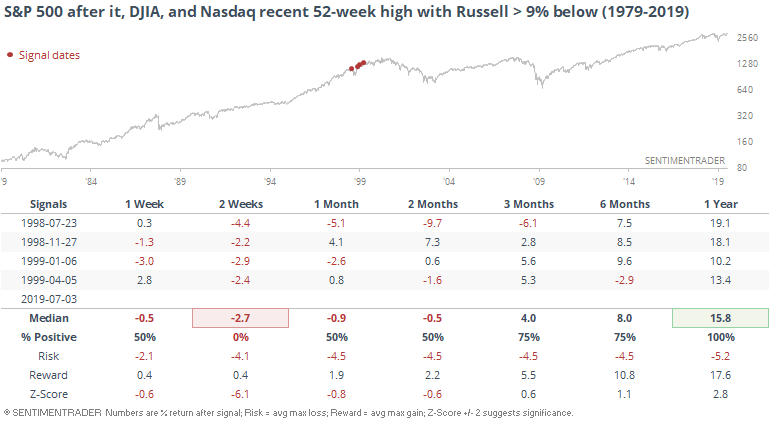
Requiring the three indexes to hit a new high on the same day is pretty restrictive, so if we relax that a bit and look for times when all three hit a high at some point in the past week while the Russell still struggled, it gives us a couple more precedents, in April and November 1998.
If we relax it still further and only look for a 5% lag in the Russell, then a few more instances pop up.
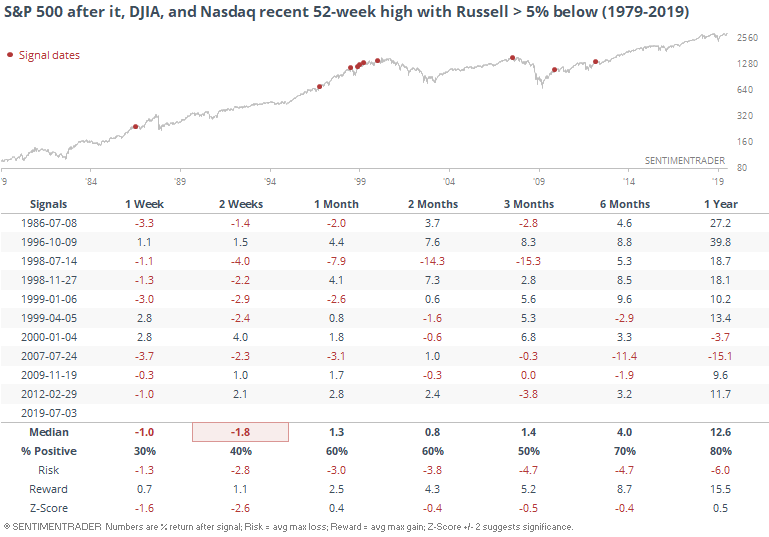
This was still not a great sign, though stocks didn't suffer any ill effects in 1996 or much of one in late 1998-early 1999 (for a while). Still, over the short- to medium-term, risk was high relative to potential reward.
Poor Economy
We've already seen that economic surprises in the U.S. have lagged the world, and Macrobond notes that even within the U.S. they've lagged the performance of the stock market. There is usually a closer positive correlation between the two.
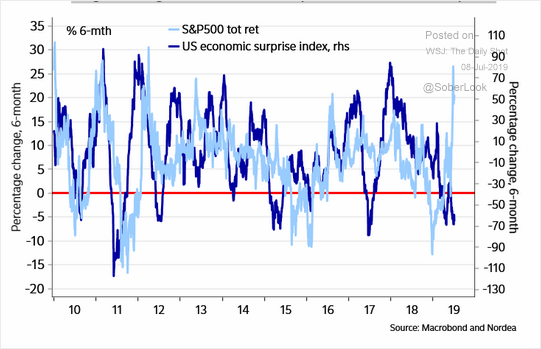
The Citi Economic Surprise Indexes use a 3-month rolling lookback period, so if we look for other times when stocks have rallied well over the past few months while economic surprises have been poor and declining, we get a handful of hits.
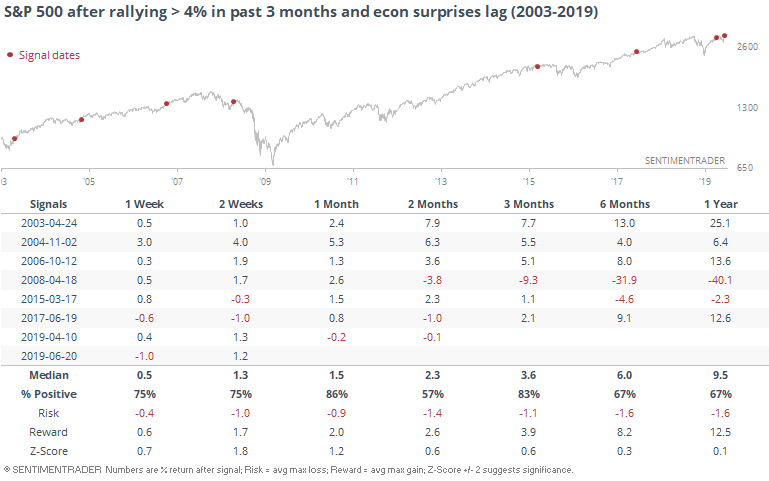
Future returns were fine, especially over the next month. Several of those soon faded over the next couple of months, though, including all of them since the financial crisis.
Bulls Return
We looked at the pessimism in the AAII survey of individual investors several times in May and June, as it has been showing a curious amount of apathy or even outright pessimism. That has usually (but not always) been a good sign for stocks.
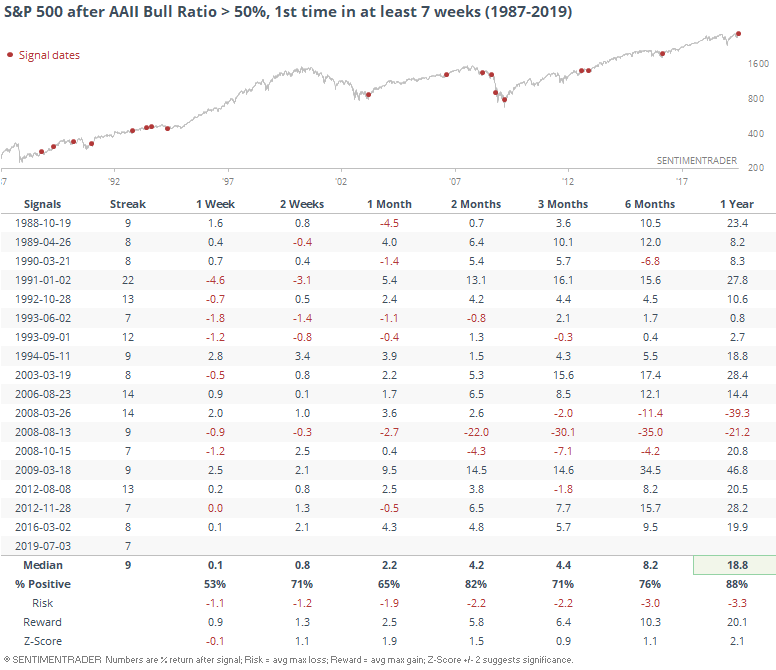
The latest survey showed the first sign of "non pessimism" in almost two months, with the Bull Ratio climbing above 50%.
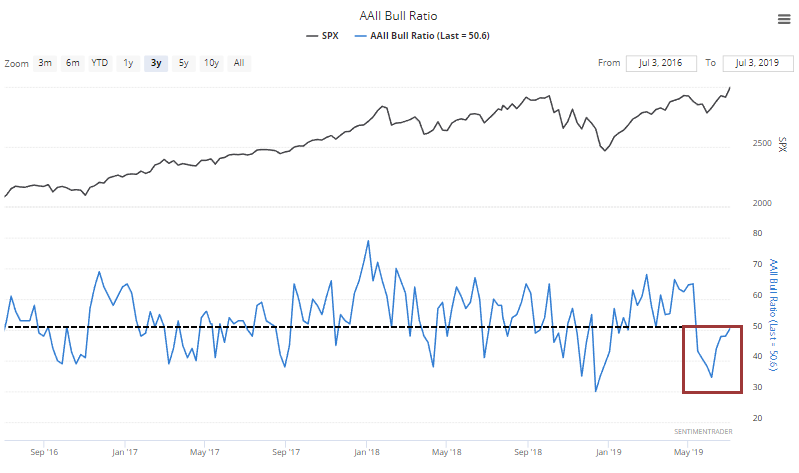
Again, this is usually a good sign, with the best signals triggering after sustained downtrends.
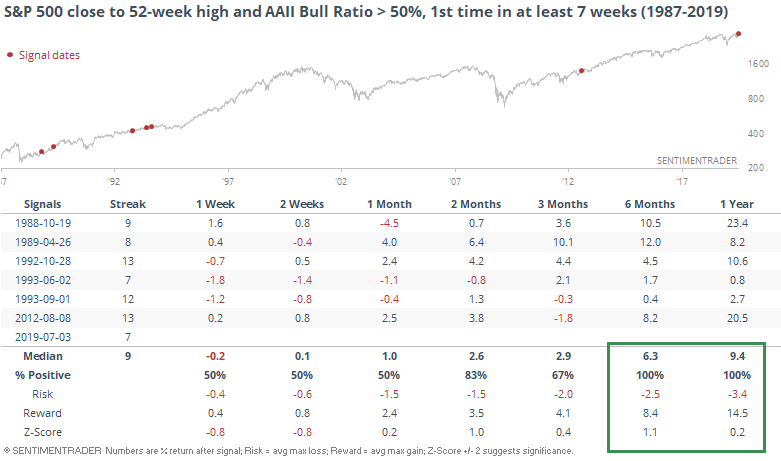
When this triggered and the S&P 500 was within 1% of a 52-week high at the time, it led to mixed returns shorter-term, but a gain over the next 6-12 months every time.
Breadth Review
Most sectors and indexes were tame last week, but there are a couple of things that stick out.
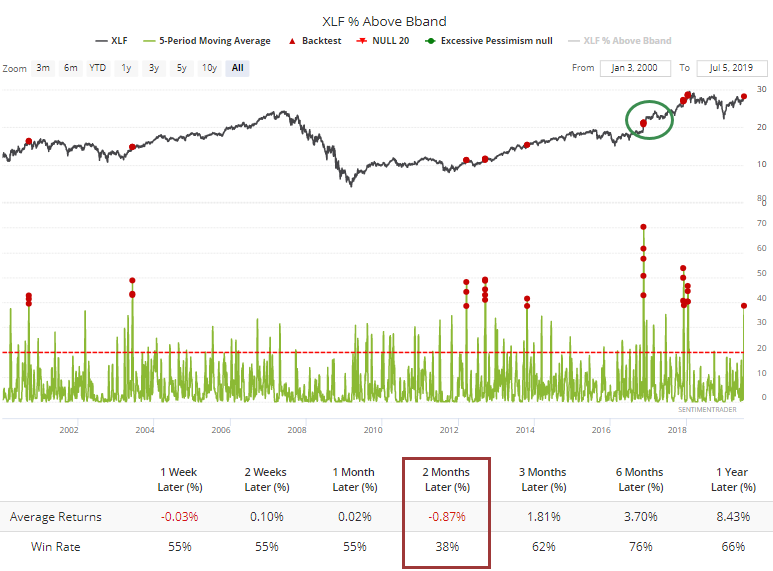
Financials have shown a sustained move, with nearly 40% of them levitating above their upper volatility bands for a week straight. This has not happened often, and the only time the sector managed to hold onto its gains over a multi-week or multi-month time frame was in late 2016.
There has been a jump in Brazilian stocks above their bands, as well, but not to a level that has preceded any kind of consistent performance in the Ibovespa. There has, however, also been a surge in the percentage of those stocks that manage to reach a 52-week high.
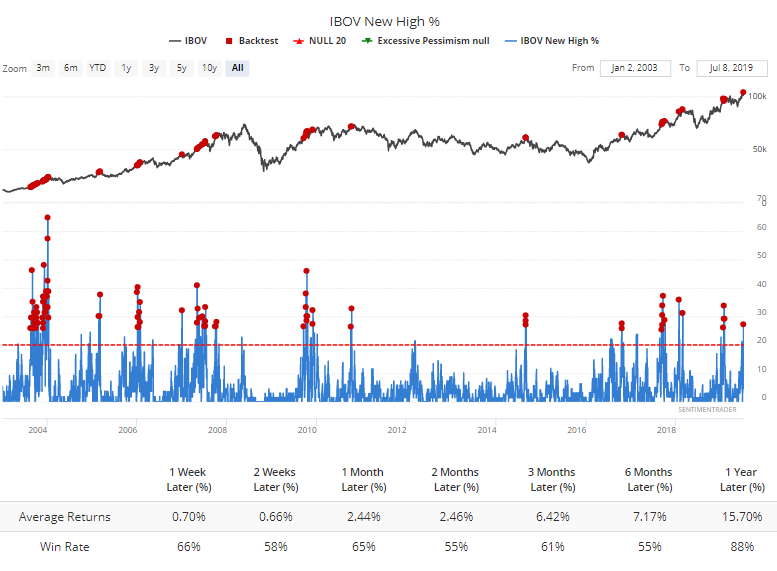
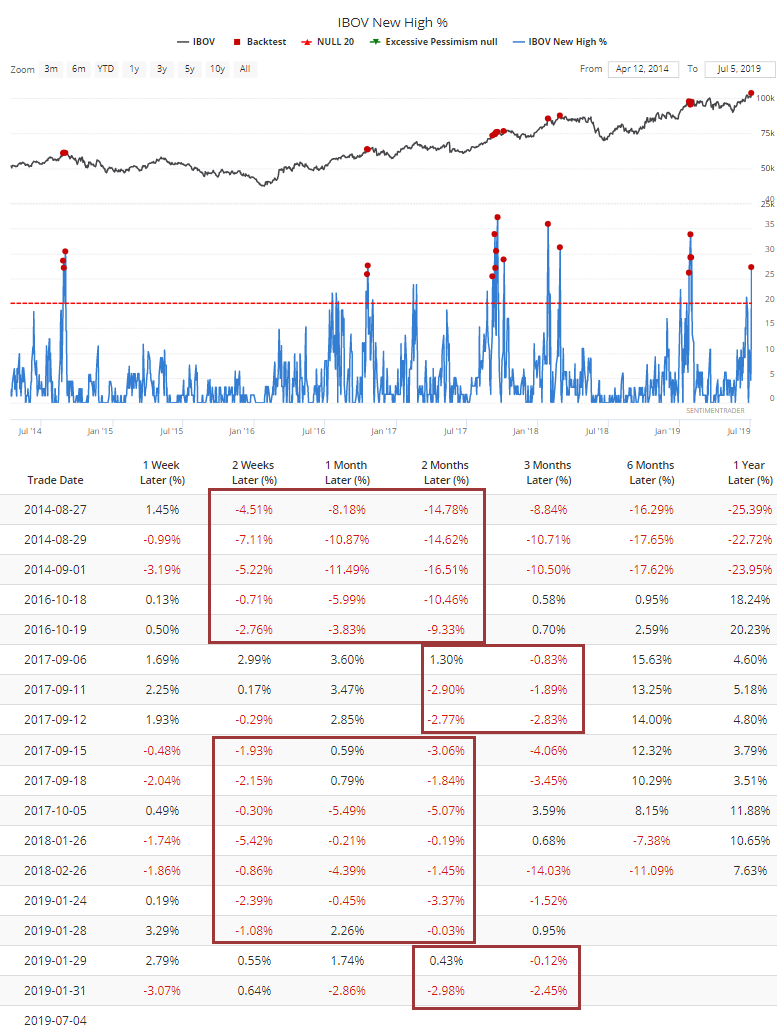
That hasn't led to anything consistent, either. But many of the good returns came prior to the last five years. If we zoom in on the last half decade, then every time this many stocks hit a new high, the Ibovespa showed a negative return at some point over the next 2-12 weeks.
Bond Optimism
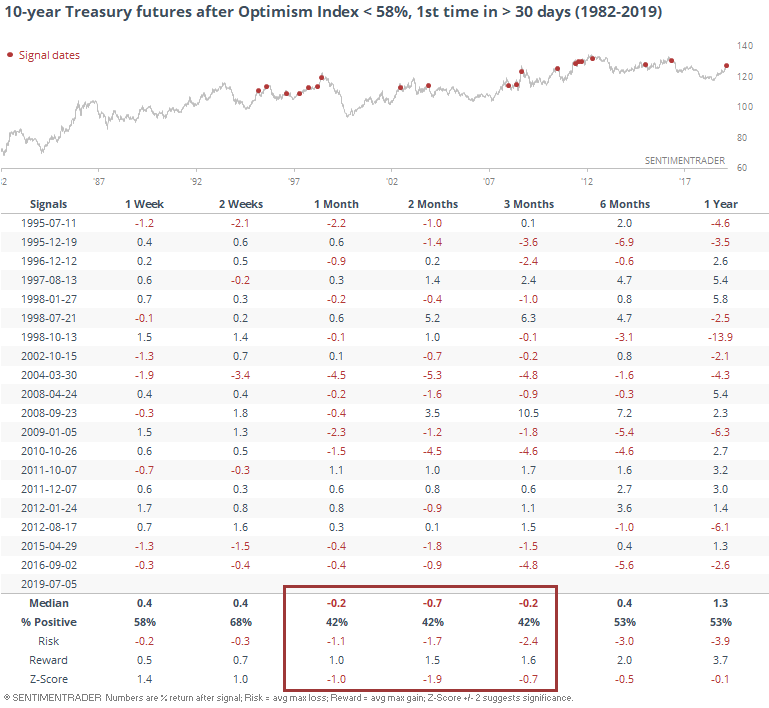
In previous weeks, we've looked at the extremely high level of optimism in bonds, which has started to come down. For the first time in 30 days, the Bond Optimism Index has dropped below 58%. When this happened in September 2016, it was the start of a slide for bond prices.
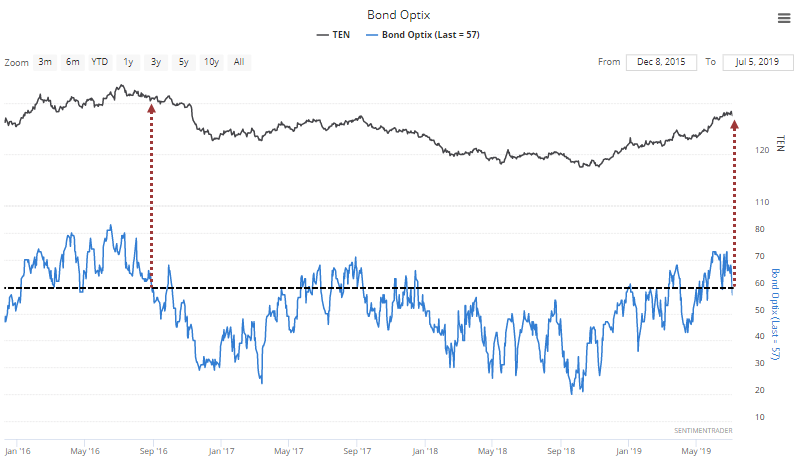
Historically, the unwinding of high optimism has tended to lead to further erosion in bond prices (rise in yield).