
Monday color - Nifty rebound, a rocky week, small traders

Here's what's piquing my interest so far on a quiet day. As Troy noted over the weekend, most signs are still pointing higher but with less of a positive edge than we've seen in recent months.
Nifty's Turn
A couple of weeks ago, we looked at the jump in Japanese shares. At the time, there was a surge underlying the rise in the Nikkei, with many stocks breaking out to their highest levels in at least a month, but still within their year-long ranges.
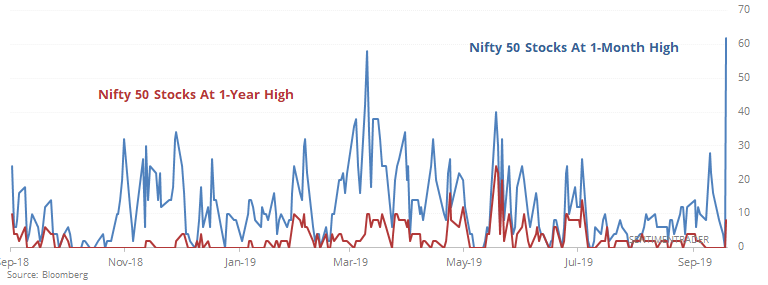
A similar development is unfolding in other markets, like Mexico. But it's most pronounced in Indian shares. Thanks to the massive rally over the past couple of sessions, the Nifty 50 index is undergoing huge internal changes.
More than 50% of stocks in the index have jumped to their highest levels in at least a month, while fewer than 10% of them have managed to break out to a 52-week high.
We typically see this in markets that have enjoyed a sudden burst of buying interest in long-term downtrends or consolidations. And for the Nifty 50, it was usually a good sign.

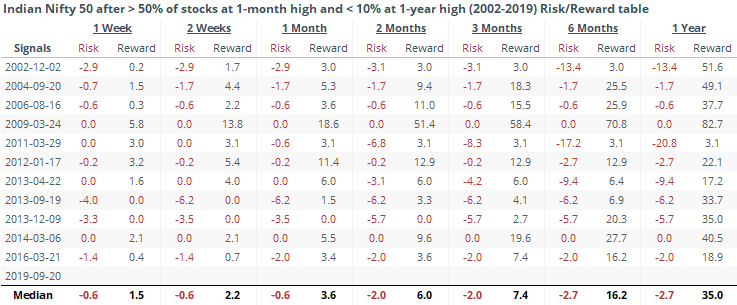
Almost every time in the past 17 years that the index saw this type of short-term burst of buying underlying the index, it has gone on to further gains. The only sustained failure was in 2011.
Looking at the risk/reward, it was massively skewed over the next year, more than 10-to-1 to the "reward" side. The Risk/Reward table shows just how small the maximum loss (risk) tended to be compared to the maximum gain (reward).
Seems like another good sign for overseas equities, especially among emerging and Asian shares.
A Rocky Week
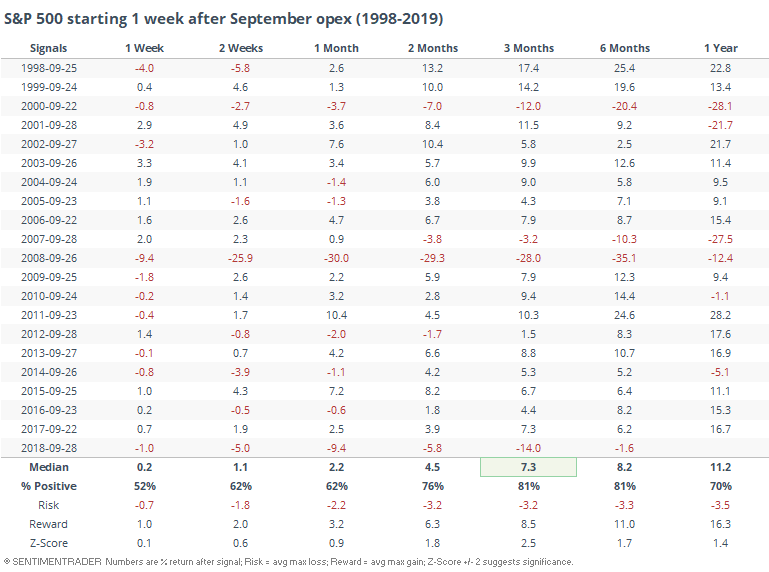
As Jeff Hirsch notes, the week following September option expiration (this week) tends to be weaker than the average month. The Monday following a quarterly option expiration has been week for a long time, as we've been discussing for nearly 20 years. It hasn't changed much over the years even though stocks are doing their best to buck the trend today. September is unusual in how persistently weak the days are for the S&P 500.
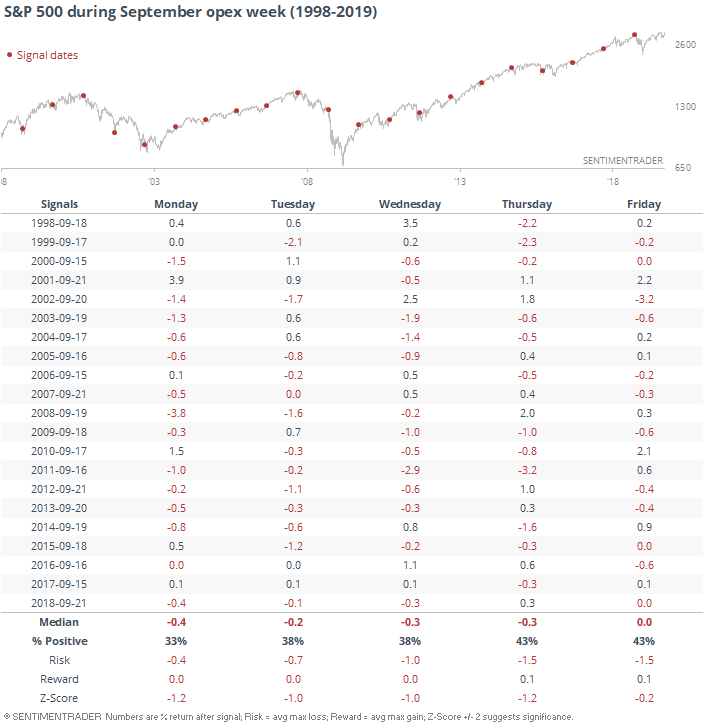
Monday has tended to be the weakest of the five days, but none of them showed gains most of the time. This only looks at the past 20 years when this kind of bias became more widely known.
The weakness was mostly temporary, though.
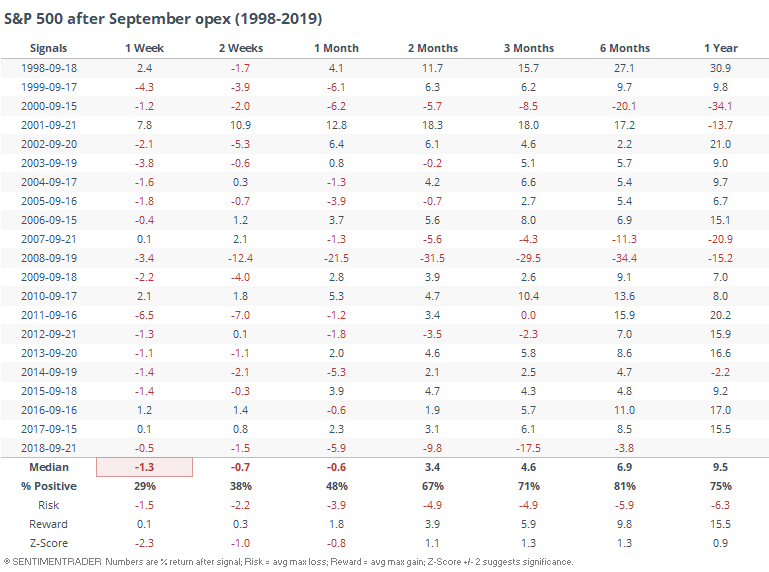
If we simply waited a week and then bought the S&P (the equivalent of this Friday, the 27th), returns were significantly better.
Small Options Traders
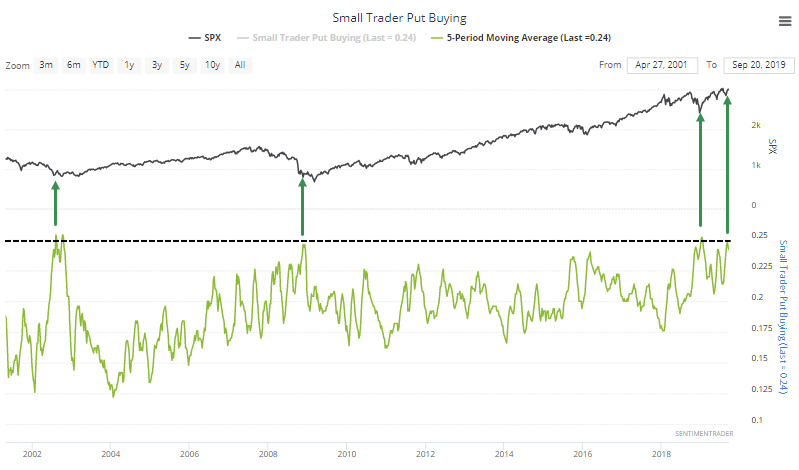
The weekly data we update over the weekend didn't show much of a change from prior weeks. The most compelling among them continues to be the behavior of the smallest of options traders. Even with a decent market, they're still buying a boatload of protective put options.
Over the past 5 weeks, they've spent nearly a quarter of their options volume on these protective strategies, which ranks among the most in almost 20 years. The only three precedents all came as stocks were forming major bottoms.
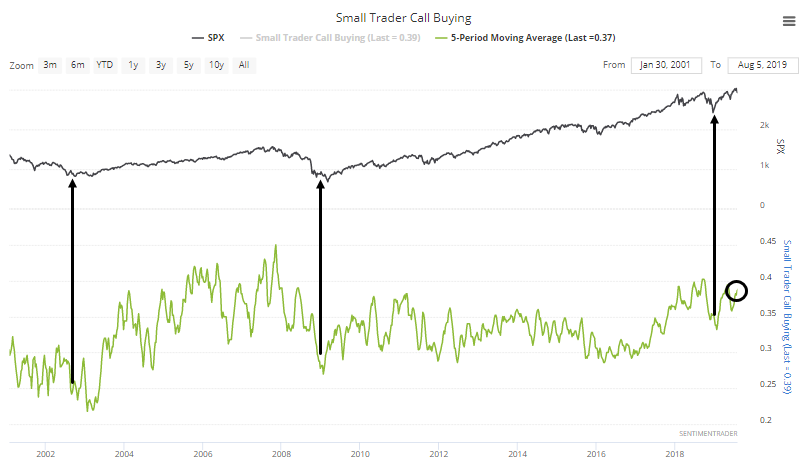
One difference is that they're still buying a lot of calls, too. Unlike the other times when they were buying a lot of puts and their call-buying volume fell drastically, this time it hasn't.
That leaves the ROBO Put/Call Ratio about in the middle of its range since the financial crisis.
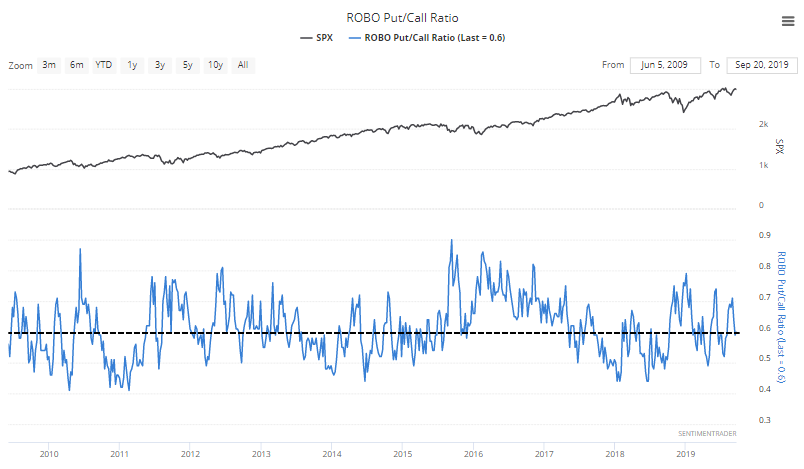
Those bullish on the market would like to stop at the first chart, and those who are bearish will pick up on the second. Neither one tells the whole story, with the ROBO ratio providing the most balanced view. It's not saying much since it's stuck in the middle of its range, but with markets tickling their old highs, at least we can say that small traders are showing some apprehension and that has usually been a positive sign.