Monday Color - Gaps, Volatility Jump, Options Buying, Warning Cluster, Hong Kong

Here's what's piquing my interest as traders gear up for a bout of Monday morning volatility.
Splat
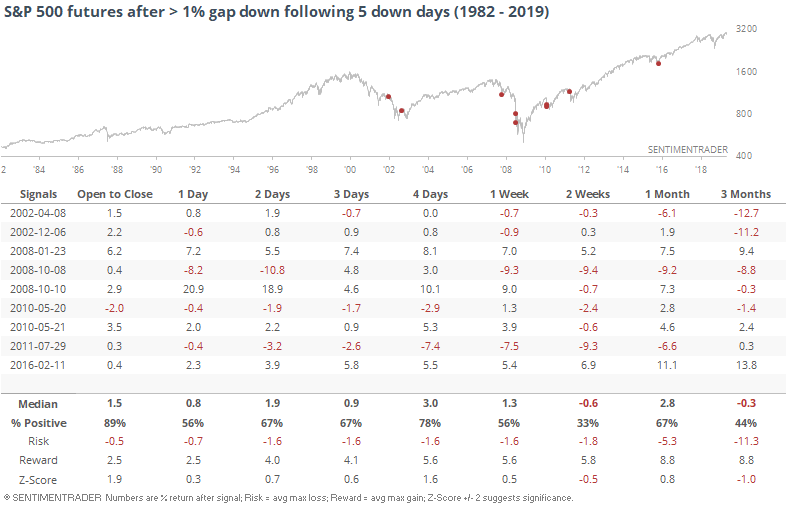
Traders get to start the new week staring at large losses in the futures. That follows a week that was pretty much straight down, with the S&P 500 losing ground for the past 5 sessions.
We haven't faced this kind of opening pessimism since 2016. The other times it triggered, there was some buying interest on the day of the large gap (i.e. today), but most didn't hold longer-term.
It's also Monday, and traders have a tendency to overreact to weekend news events. If we look for a large gap down on a Monday following multiple down days, it's not quite so negative.
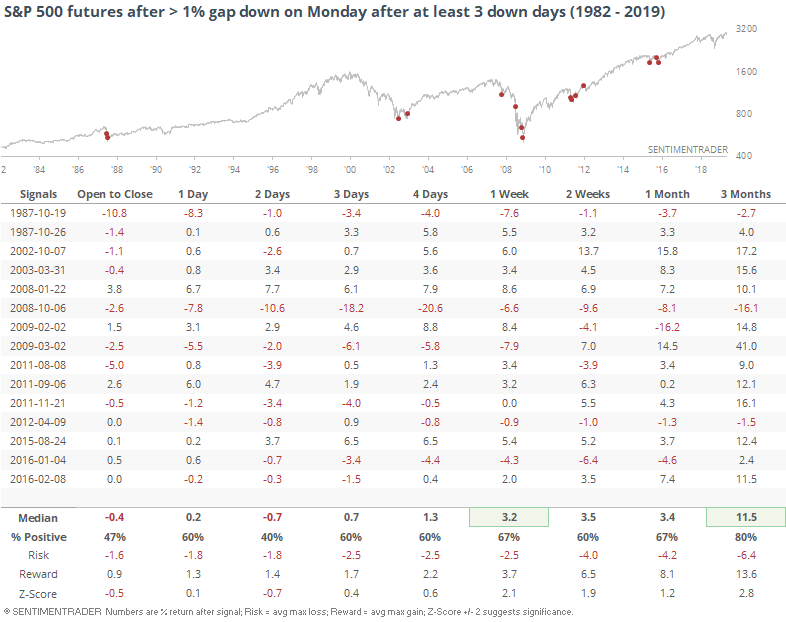
We can see from the charts above that many of these triggered during the bear markets in 2001-02 and 2007-08. If we only look at large gaps down that triggered within a week of a 52-week high, traders' behavior turned more optimistic.
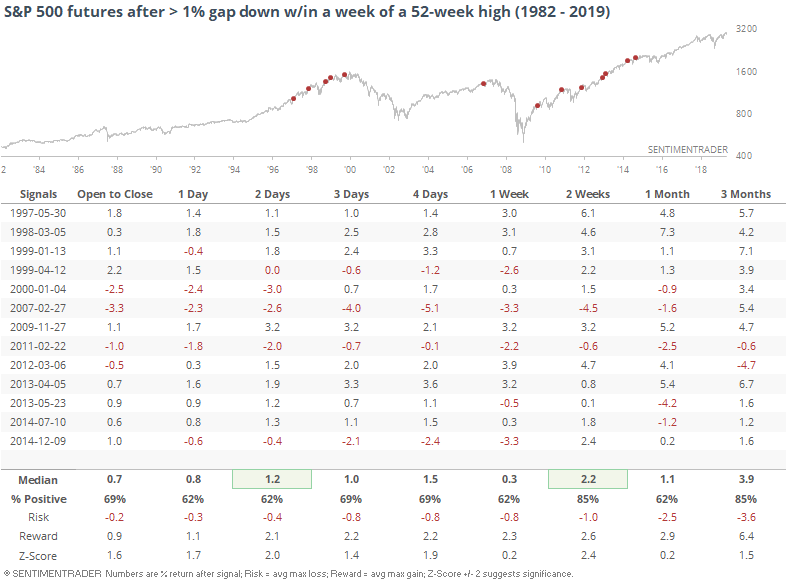
In these cases, the futures were higher two weeks later all but twice, and only one of those showed meaningful weakness. Even that one's loss was quickly erased.
Seems like a modest positive, especially shorter-term.
Warnings
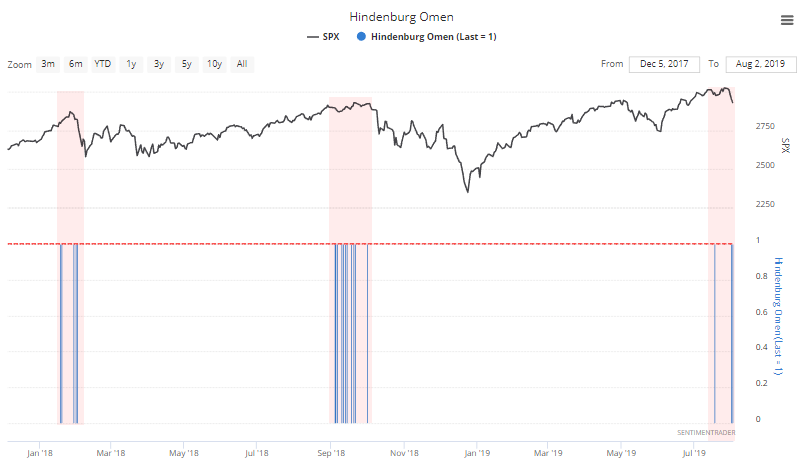
The biggest warning sign among the indicators we follow continues to be the "split" market. We looked at this various ways a couple of weeks ago, and it was ringing the alarm bells.
If we ignore the silly names and focus on what these warnings are saying, then it's telling us that while stocks were rising over the past few weeks, too many stocks were diverging strongly from the trend, on both the NYSE and Nasdaq exchanges. We saw that as stocks were rising to new highs, we should be wary. Even after the selling last week, the warnings continued to trigger, with Hindenburg Omens occurring last last week on the NYSE. It has paid to heed these warnings over the past couple of years.
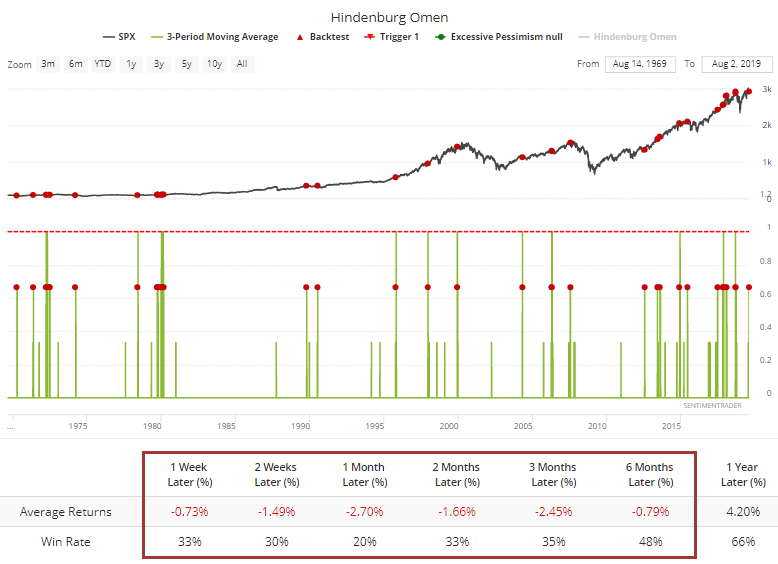
These signals have failed at times in the past, like in 2017. But longer-term, they have been helpful. If we look for little clusters, at least 2 Hindenburg Omens in the past 3 sessions, future returns in the S&P were bleak. Only 9 out of 46 signals (when the 3-day moving average crossed above 0.66) resulted in a higher index a month later. Ouch.
It's not just the NYSE, and it's not just the Hindenburg Omen. The Titanic Syndrome has also been triggering (again, let's try to ignore the names and focus on the message). This tells us that even though the indexes recently were sitting at new highs, there were more securities sliding to 52-week lows on the exchange than rising to 52-week highs.
Both warnings have been triggering on both the NYSE and Nasdaq consistently over the past few weeks. Enough to be considered a cluster, and clusters have been bad.
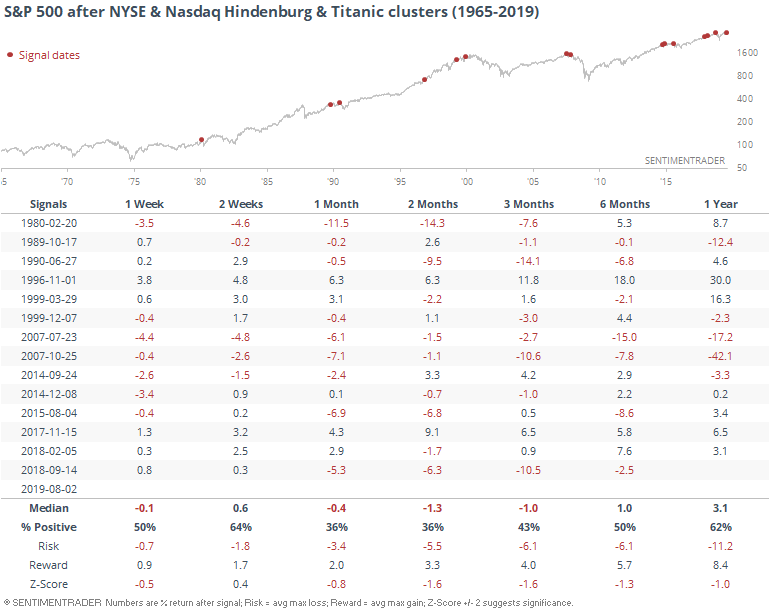
The only times that escaped further selling pressure were November 1996 and November 2017. We don't have that positive year-end seasonality working for us now.
Volatility Explosion
The jump in concern has pushed the VIX more than 75% above its low from the past couple of weeks.
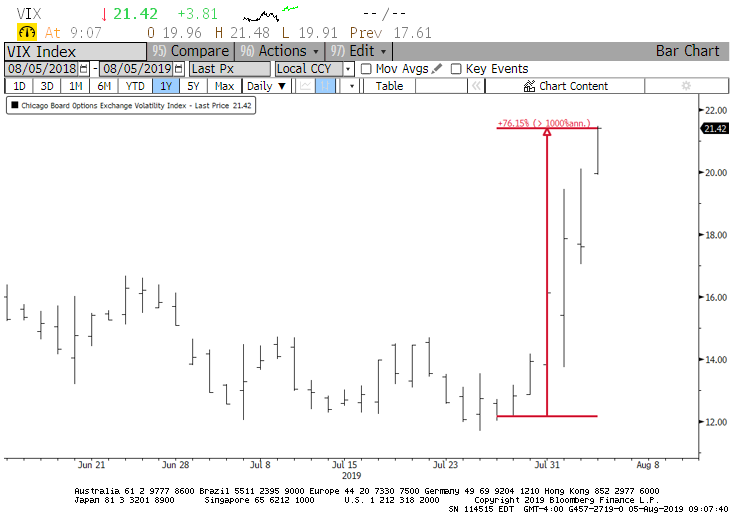
That's a lot, but it has not been an adequate signal that traders are panicking. Over the next couple of weeks, the S&P actually showed quite poor returns.
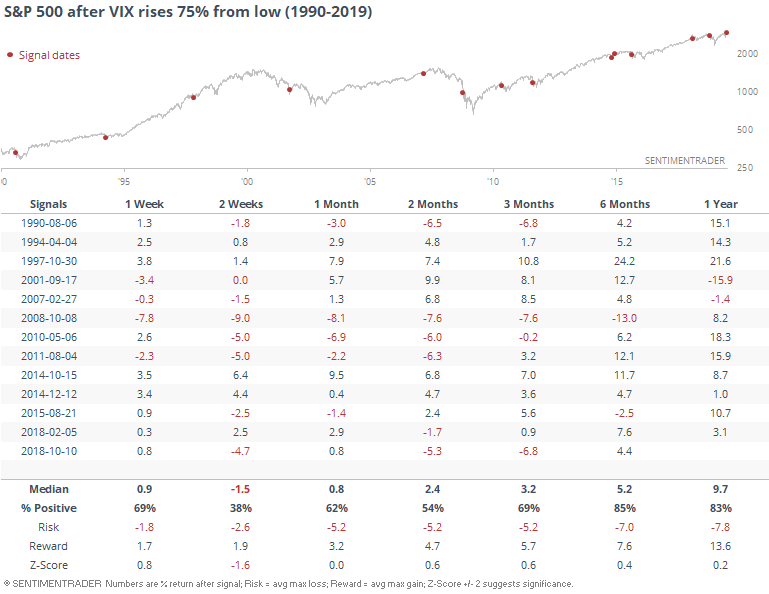
Remarkably, it's jumped this much and is still (well) below 30.
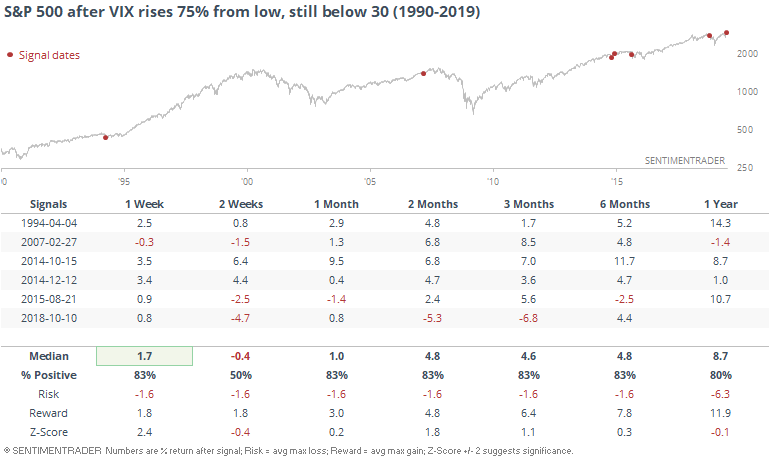
These sudden jumps in fear during overall low-volatility conditions are rare, and have usually preceded a return to normalcy over the medium-term, though the sample size is small.
Small Traders
One of the big warning signs a couple of weeks ago was the speculative enthusiasm among the smallest of options traders. They spent more than 40% of their volume on buying call options, something that has preceded very weak returns for stocks.
They backed off a bit but then in a troubling sign, actually increased their call buying last week.
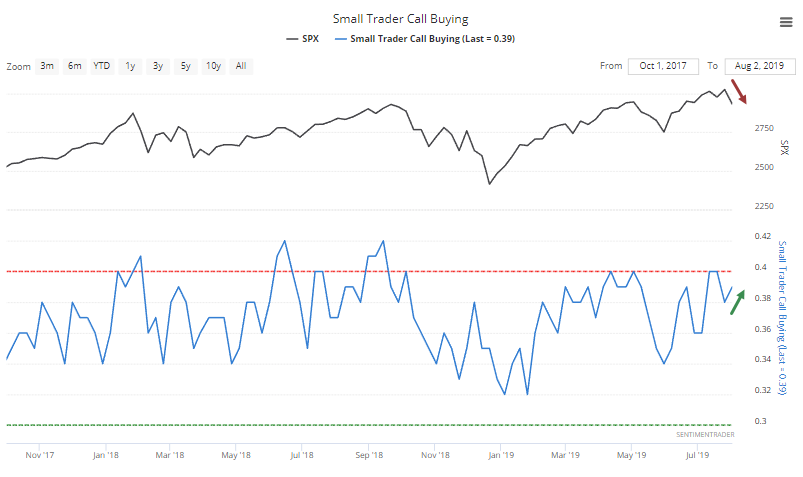
No sign of panic, or even concern, there, which is usually not a good sign at all.
Sector Breadth
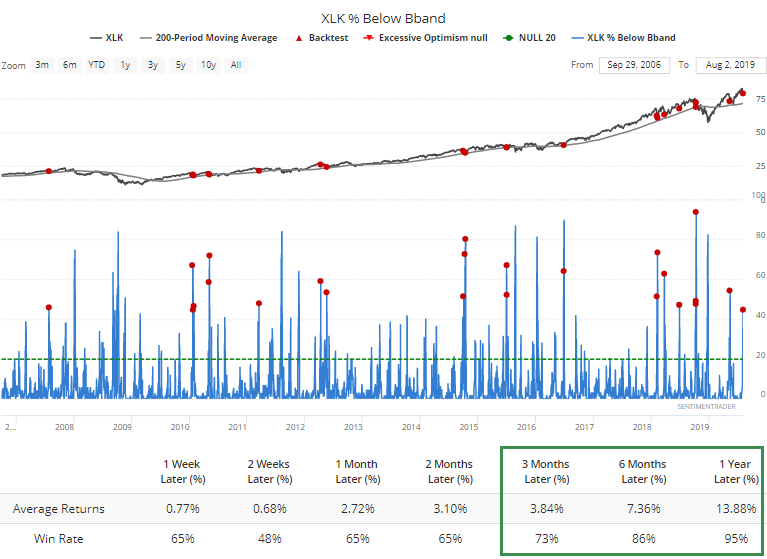
The heavy selling on the Nasdaq that triggered these warnings, and so many new lows, can also been seen in some of the breadth metrics. More than 44% of tech stocks have sold off hard enough, and swiftly enough, to trade below their Bollinger Bands.
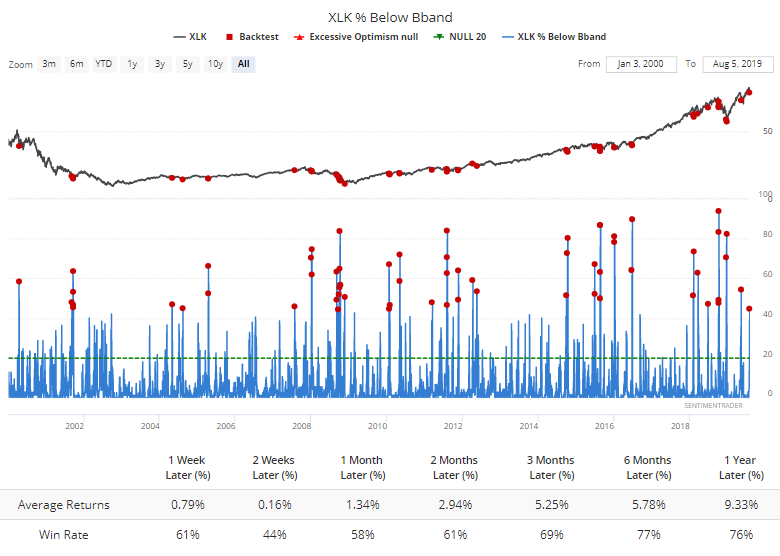
That's the case even though tech indexes and ETFs are still trading above their long-term moving averages. That has improved longer-term returns, since most of them triggered during the past 10 years.
The severity and breadth of the drop has also pushed the McClellan Oscillator for tech to a very low level.
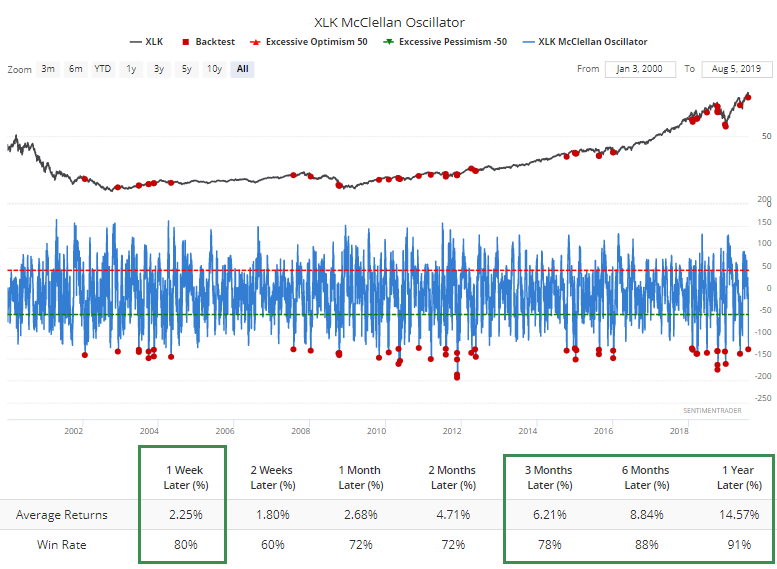
That's been a decent sign of oversold, especially during a generally rising market.
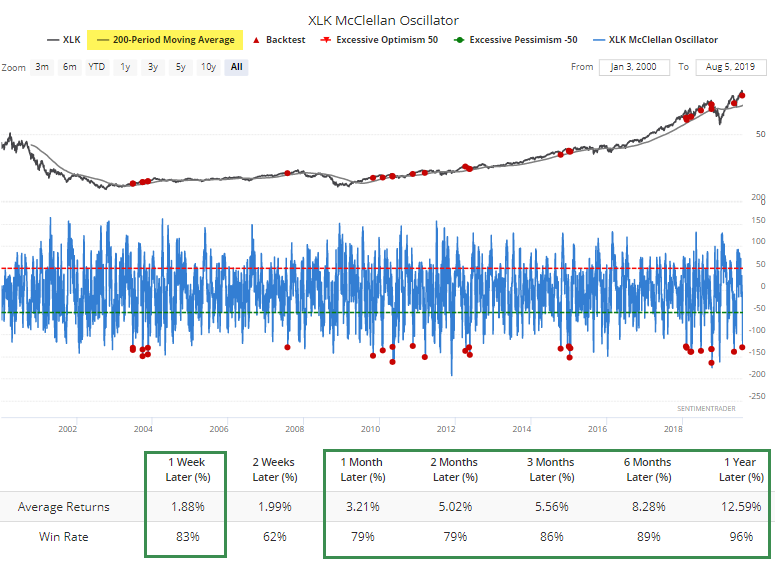
Is it enough to offset negatives like the split market highlighted by the warning signs noted above? Probably not, since the oversold suggestions are still not widespread.
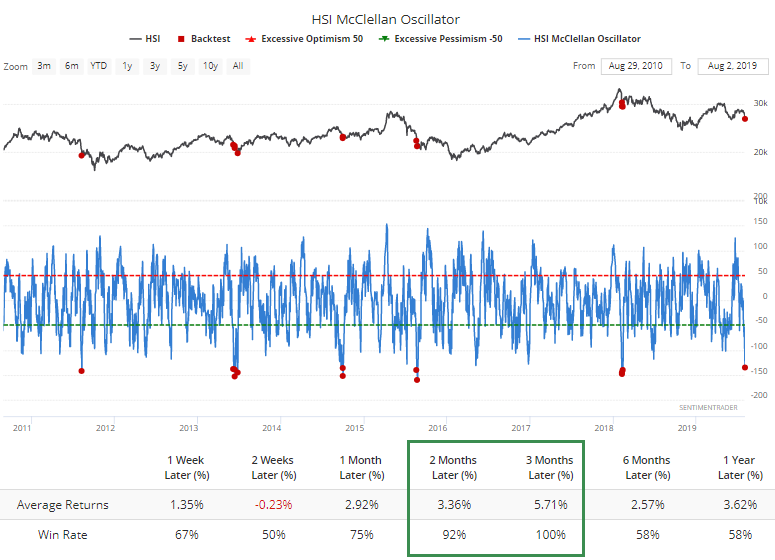
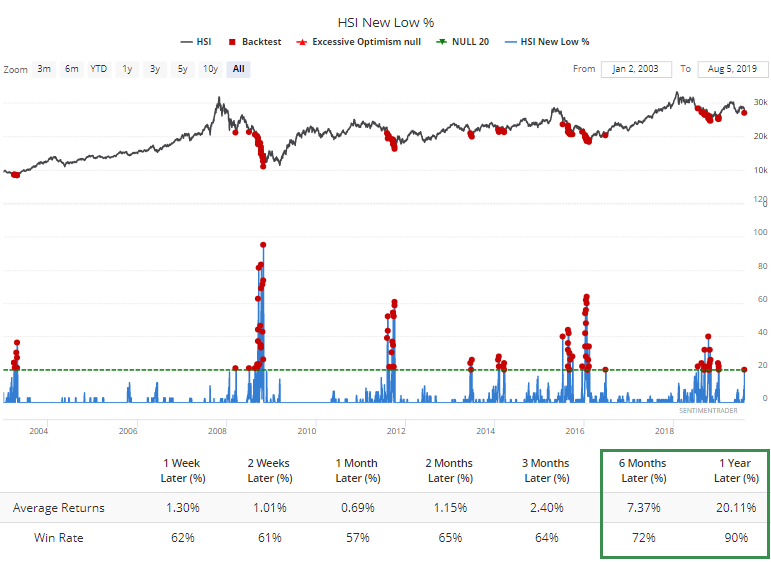
One market where those signals are widespread is in Hong Kong. Investors have become spooked, and nearly half the stocks have sold off enough to become oversold.
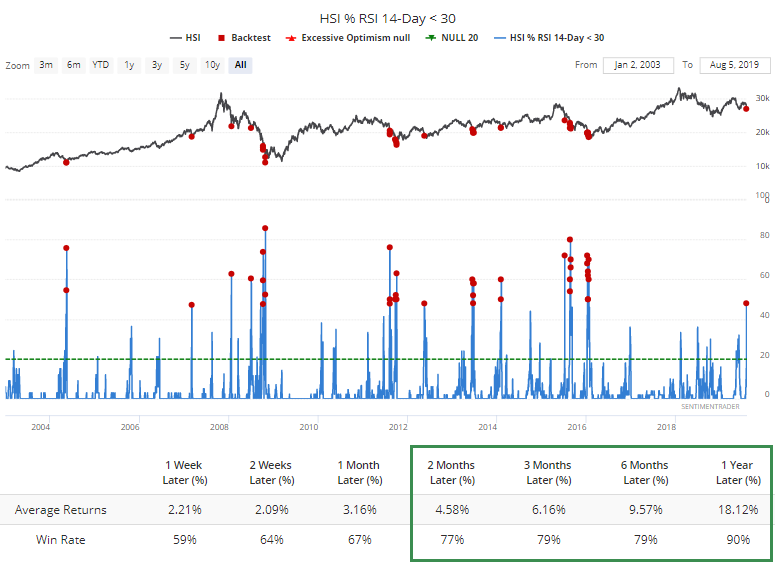
That has pushed almost a fifth of them to hit 52-week lows. Not quite enough that signals all-out widespread panic, though.
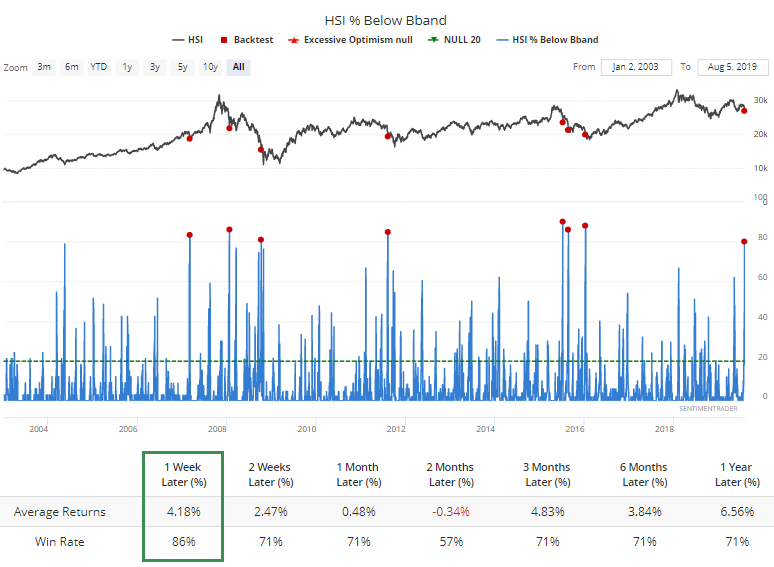
The reaction has been so swift that 4 out of 5 stocks in the Hang Seng are trading below their lower volatility bands. That does suggest some level of panic, but it hasn't been a foolproof signal that the selling pressure is over. It was best only in the very short-term.
The Oscillator there has sunk to one of its lowest levels in 15 years. The market bounced back over the next 2-3 months the other times it got this low.