Monday Color - Better Appetite, Seasonal Fears, Expensive Utes, Overseas Jump, Sugar Dump

Here's what's piquing my interest on a so-far quiet start to the week.
Returning Risk Appetite
Over the past few weeks, we've gone over many signs that investors are seriously anxious. To an extreme and surprising degree, given that stocks were holding up relatively well.
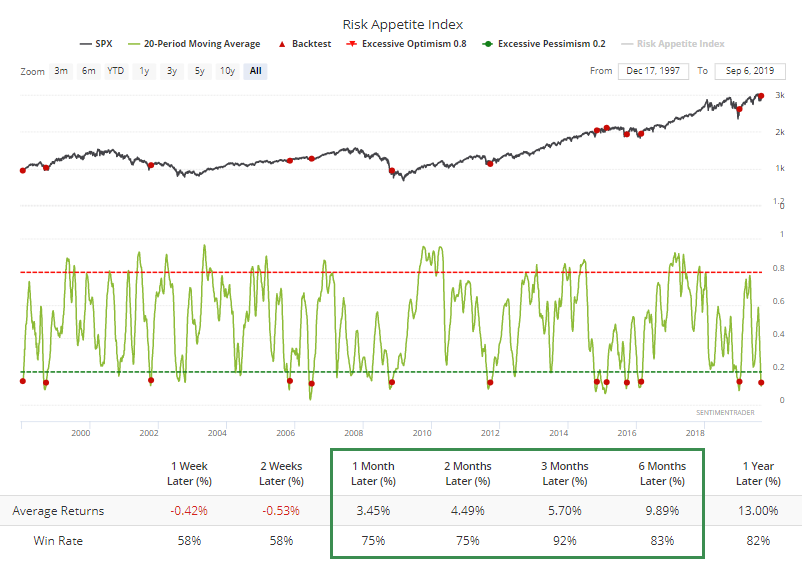
Now we're starting to see sentiment curl up a bit across asset classes. The Risk Appetite Index had dropped to a very low level over the past month, and is just now starting to curl up. That has been a good medium-term sign with only one loss over the next 3 month (though it was large).
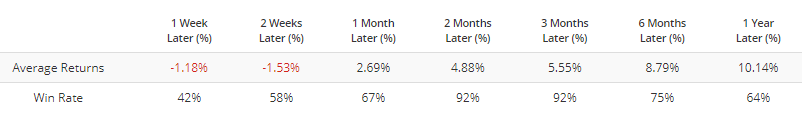
It's been an even better sign over the next 2-3 months for some of the "riskier" major indexes, like the Russell 2000:
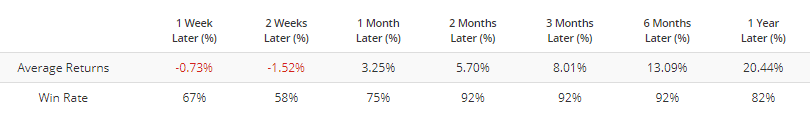
And Nasdaq Composite:
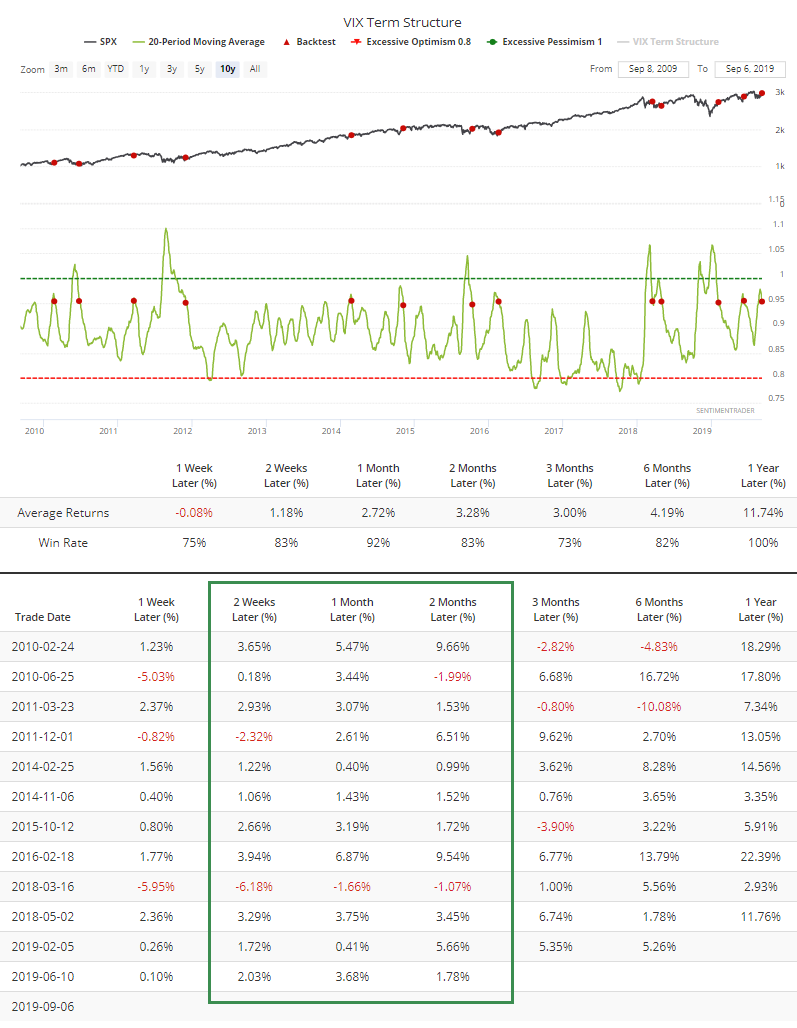
We can also see that in the VIX futures curve. Volatility expectations are starting to normalize, and the 20-day average of the VIX Term Structure has curled below 0.95, something that has led to only one negative return over the next month since the financial crisis according to the Backtest Engine.
Rocky Patch
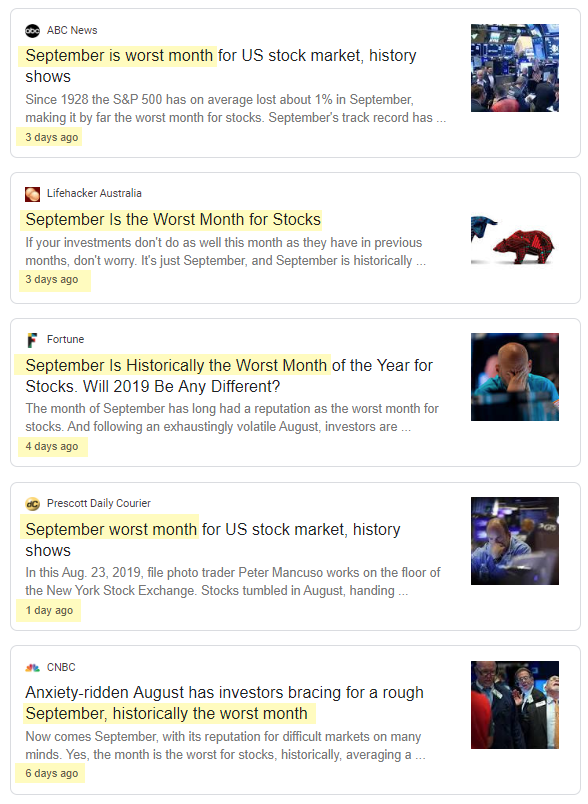
One of the hindrances that people seem to have about embracing a bullish view right now is seasonality. As the media is constantly reminding us, "September is the worst month for stocks."
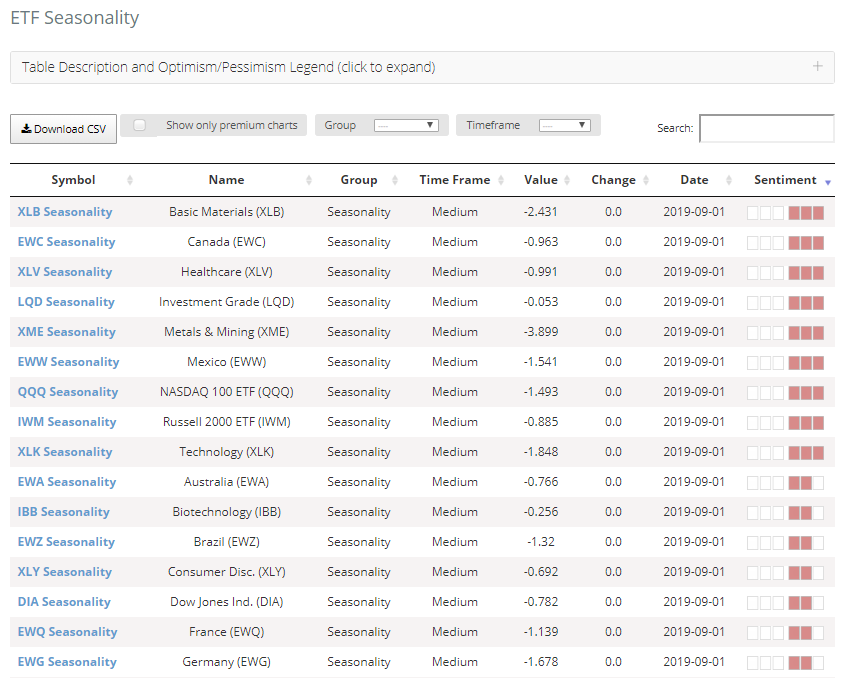
There is, indeed, a lot of red marks on the ETF Seasonality page.
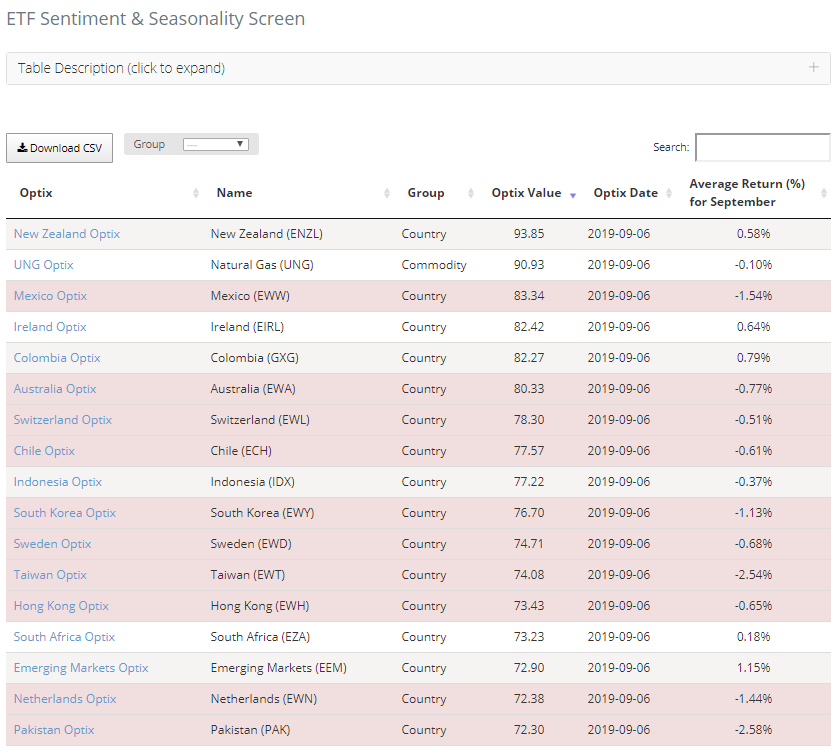
And the Sentiment & Seasonality Screen is showing a lot of funds (mostly focused on overseas markets) with high optimism that have a negative historical return for September.
Context matters, so let's look at the 16 times since 1928 when the S&P 500 was up at least 10% year-to-date through the first week of September, and within 2% of a multi-year high.
Below is a composite of the S&P's price path going forward, though about year-end.
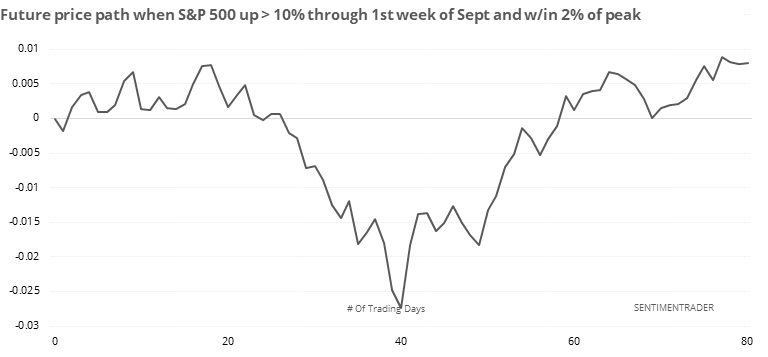
It tended to see choppy gains for about the next month (early October), then a rough patch from roughly days 20 through 40, which would very roughly equate with the middle of October. Maybe it's not September investors need to worry about, but October.
Sectors
With the breakout from ranges on Friday, a few sectors saw a pop in the percentage of stocks trading at shorter-term extremes, not much different from what we went over in Friday's report for the S&P 500 with a jump in the number of stocks hitting one-month highs.
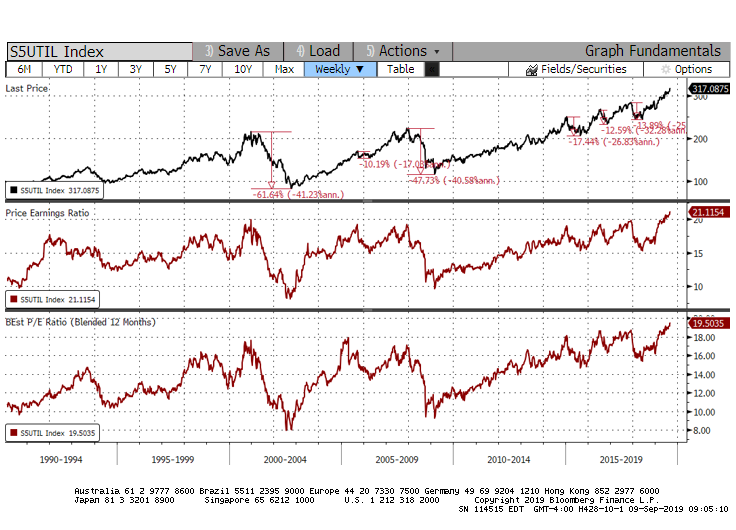
On Thursday, we saw that the big jump in new 52-week highs among defensive sectors consistently led to gains for the broader market, and poor returns for those specific sectors. With weakness on Friday, staples and utilities saw a collapse in stocks hitting new highs, only a slight relief. As the WSJ notes, sectors like utilities are the most expensive they've been since at least 1990.
Using Bloomberg data for the S&P 500's utility sector's historical and forward P/E ratios, every time they've neared or exceeded 18, utilities have sold off by a minimum of 10%.
On a shorter-term basis, the moves late last week caused many stocks to jump above their upper volatility bands, since many of them had coiled into tight ranges over the past month. Note that a lot of them are overseas indexes.
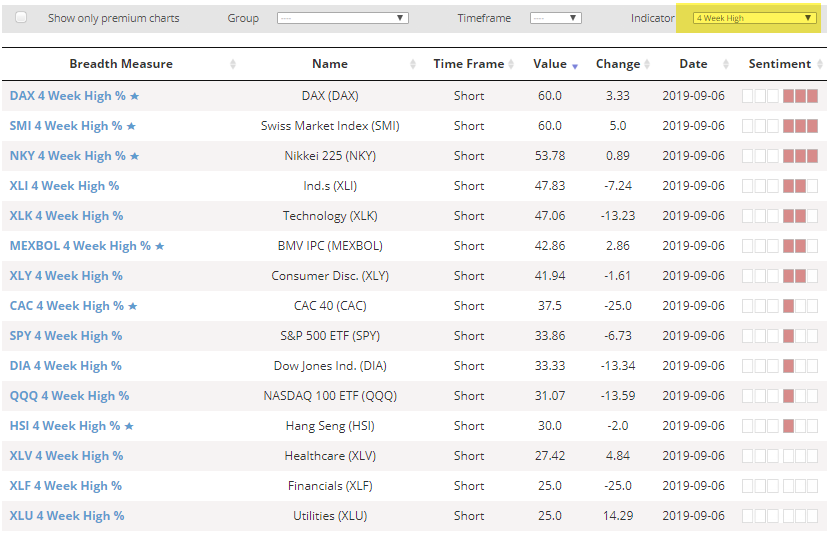
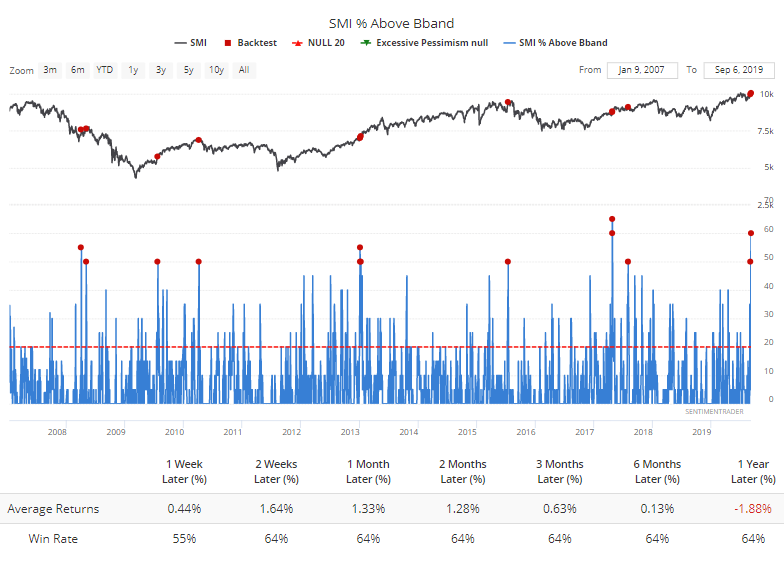
The Swiss Market Index saw the biggest increase, and well over 50% of the stocks are jumped above their Bollinger Bands. That has led to inconsistent returns.
The German DAX is also seeing a number of stocks showing quick surges out of their recent ranges.
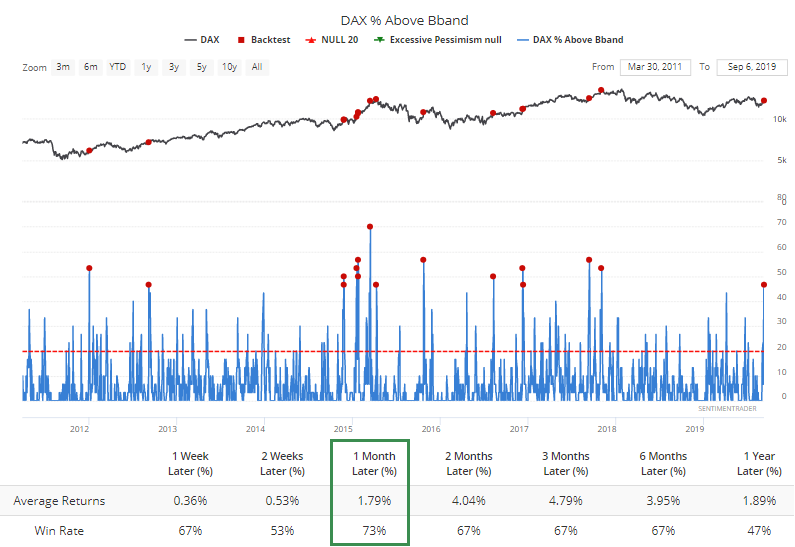
That has led to better returns, especially over the next month. The losses tended to come when the DAX was already trading at or near a high, suggesting too much optimism. When it was emerging from a selloff or trading range, like now, it tended to be a better sign.
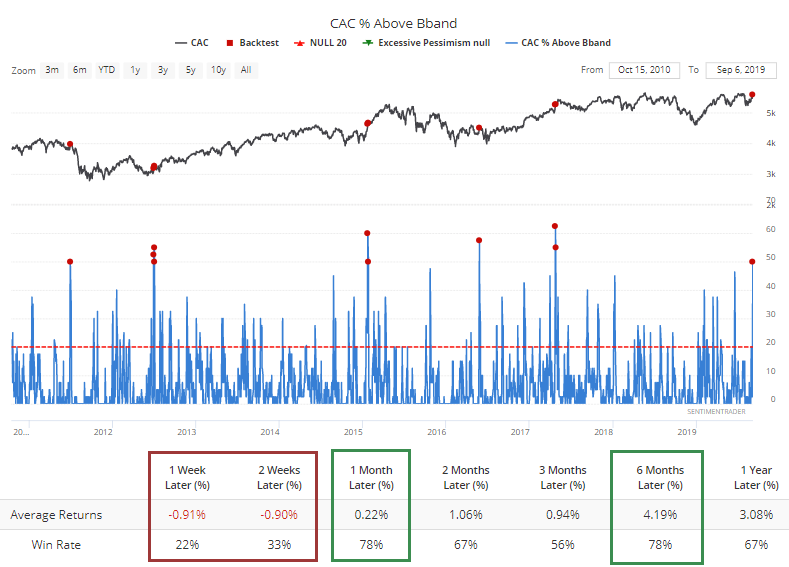
It's happened in the French CAC 40 as well, which preceded weaker short-term returns, but decent ones after that.
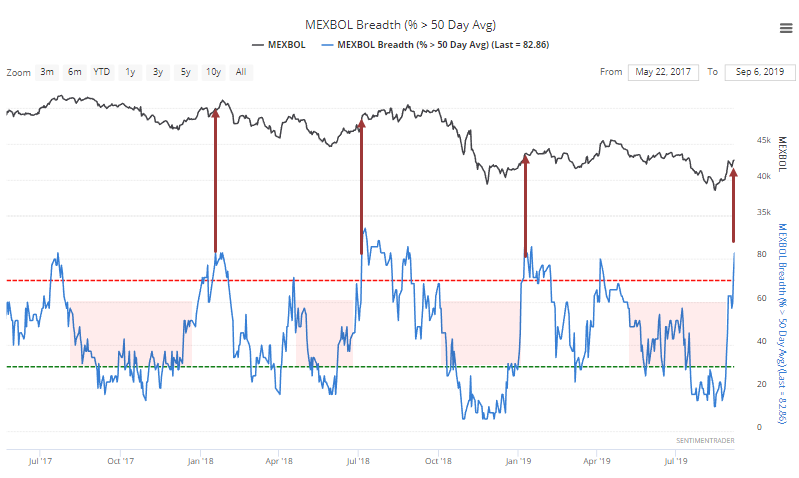
There have been signs of recovery in Mexico, which we looked at last week. It's been enough that now more than 80% of stocks in the Mexbol index are trading above their 50-day moving averages, the most since the start of the year. This is coming after months when the market was so suppressed that it never managed to get more than 60% of its stocks above their averages.
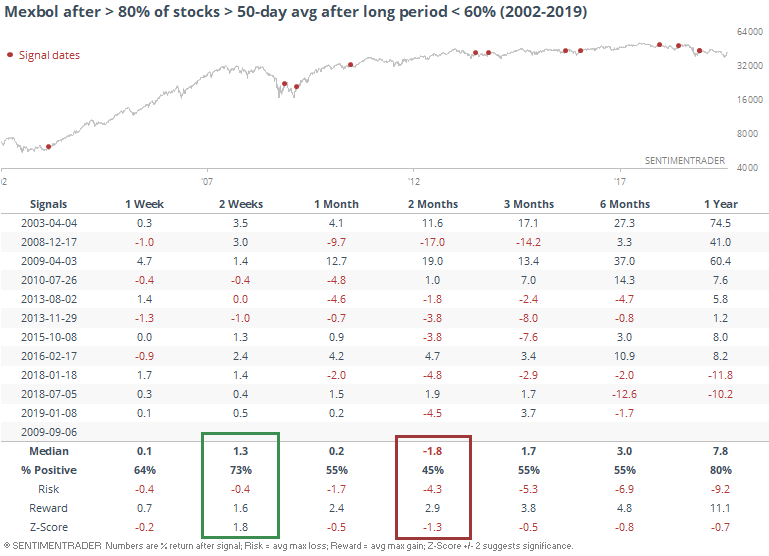
The last few times this happened, the index managed to tack on some shorter-term gains, but then rolled over. Going back to 2002, that was a consistent pattern, with good returns over the next 2 weeks, but then mostly negative over the next 2 months.
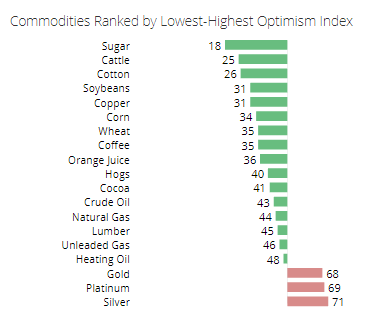
Low On Sugar
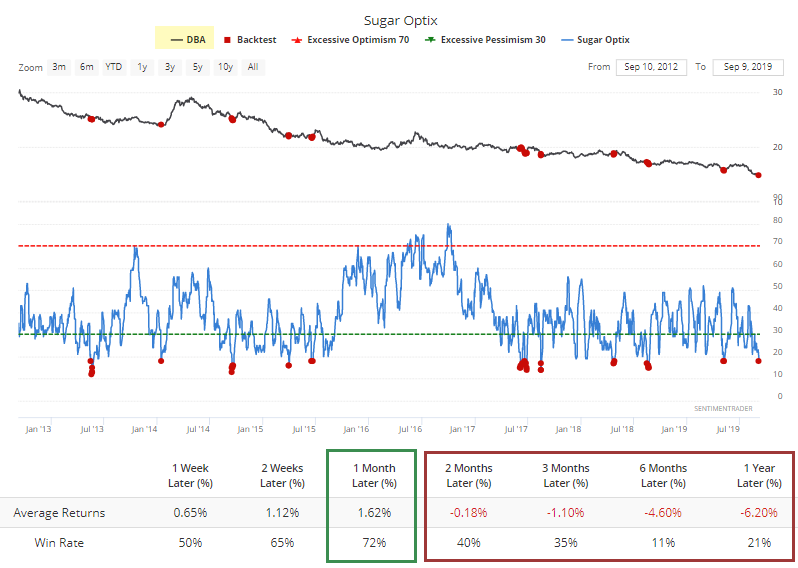
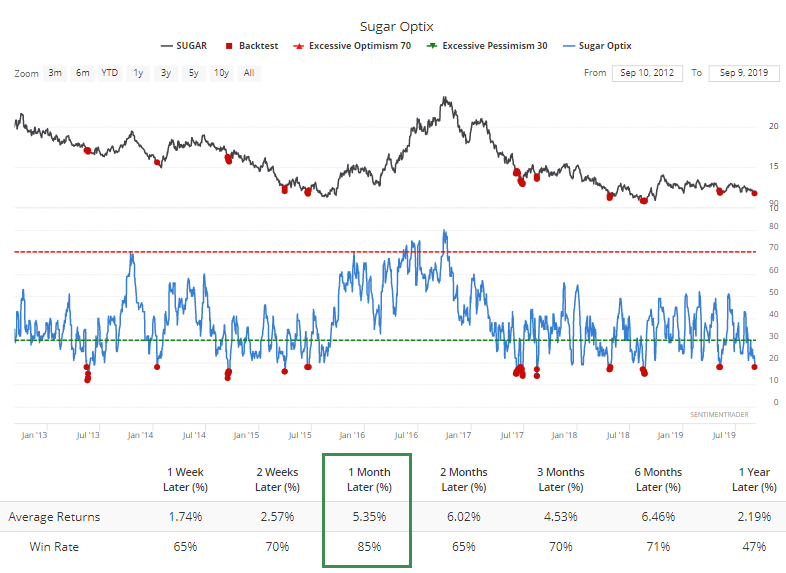
Many commodities have had horrendous years, building on what had already been a stretch of bad years. Among them, sugar is now the most-hated.
According to the Backtest Engine, over the past 7 years when the Optimism Index dropped below 19, it has had a strong tendency to bounce back over the next month.
Most people don't trade sugar futures, so if we look at more popular vehicles like the DBA fund (of which sugar only accounts for a little), it, too, has tended to rally over the next month when optimism on sugar was very low, but then fell apart.