Data &
Technology
Research
Reports
Report Solutions
Reports Library
Actionable
Strategies
Free
Resources
Simple Backtest Calculator
Simple Seasonality Calculator
The Kelly Criterion Calculator
Sentiment Geo Map
Public Research Reports
Free Webinar
Pricing
Company
About
Meet Our Team
In the News
Testimonials
Client Success Stories
Contact
Log inLoginSign up
< BACK TO ALL REPORTS

Monday Color - All About Gaps

Jason Goepfert
2019-08-19
null

Markets are jumping to start the new week, and that always seems to generate a lot of "what happens..." questions. Monday-morning gaps tend to be emotional reactions to weekend news headlines, and have generated some good signals in the past, both ways.

If you missed it, Troy posted a great weekly summary that's worth reviewing. There are some strong studies that have triggered, with a mostly positive bias as we head into the fall. The investment models that we'll be posting more information about soon are also almost all long.

Most of the indicators that we update over the weekend didn't show much movement, so not much to discuss there, and there were no new extremes of note in the breadth metrics we track for sectors and indexes.

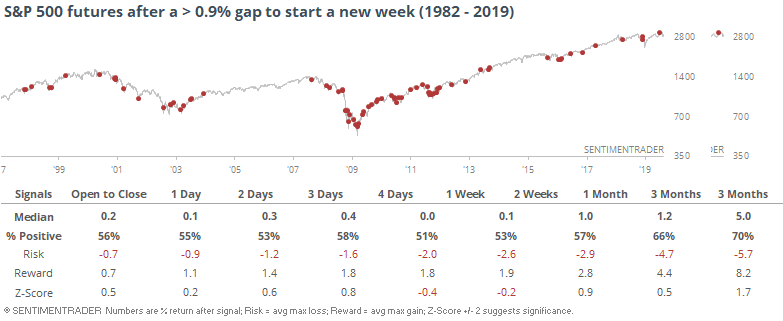
First, let's just look at every Monday (or first day of the week) gap of more than 0.9% in S&P 500 futures since their inception 1982. There were 78 signals, all of which triggered after 1997.

Just the highlights here since it's a long table. And it didn't lead to anything consistent, anyway.

Many of those occurred during protracted downtrends, which we're clearly not in. So let's filter the table to only include times when the S&P had been trading above its 200-day average as of the prior day.

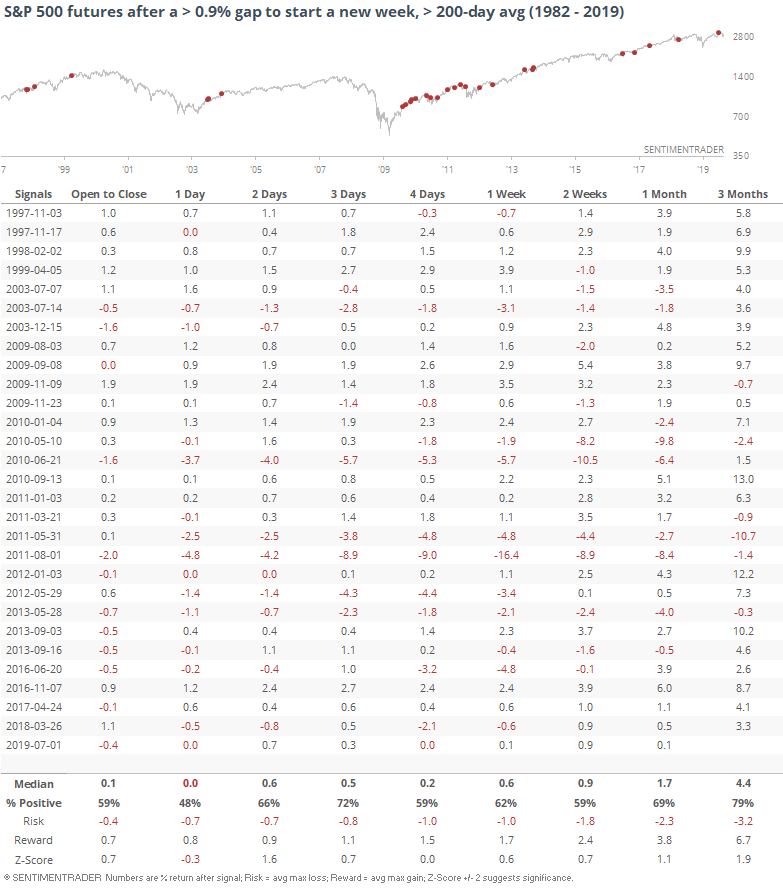
Buying into the gap led to a slight negative return over the next day, but then mostly good things after that. Only 4 of the 29 signals led to a loss of more than -10% at some point over the next 3 months.

It was even more rare to see these gaps to start a week when stocks weren't even in pullback mode. It's only happened 11 other times when the S&P had been within 5% of a multi-year high.

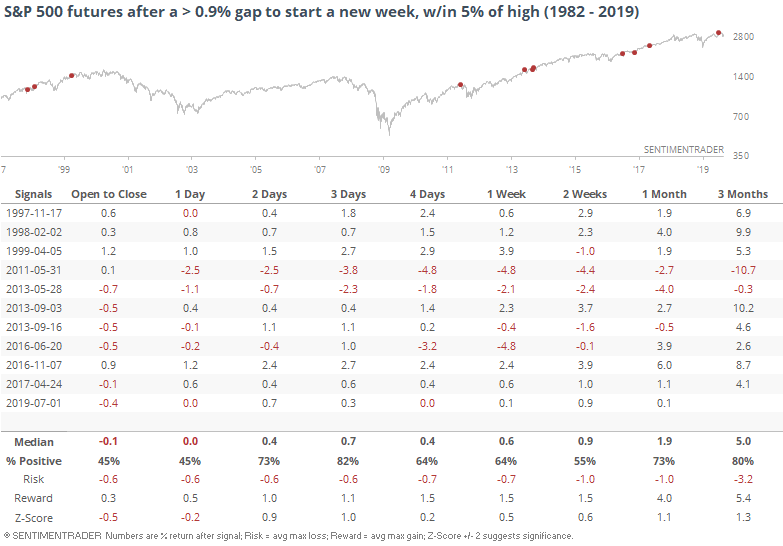
These were a bit weaker (very) shorter-term, and a bit stronger longer-term. Only 2 of them showed losses over the next few sessions and only 1 of them showed a largish loss at some point over the next few months (in May 2011).

It's rarer still to see this kind of movement in August, especially late August. The next two weeks should be some of the lowest-volume, lowest-volatility of the entire year. The last sessions in August tend to be the slowest of the entire year.

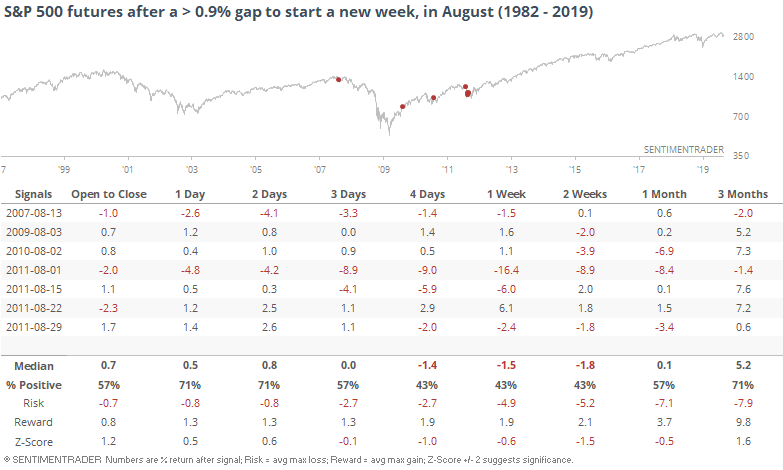
Not sure we can read much, if anything, into these moves. They mostly showed stronger returns very short-term, but weaker longer-term. But again, all but two of these triggered before the midpoint of August. The only two that triggered in the last half of the month were both in 2011.

Overall, the signals which seem most applicable due to similar environments showed a slight bias toward very short-term weakness and a strong bias toward strength over the next few days and weeks. There was only a small probability of a large loss.

Sorry, you don't have access to this report

Upgrade your subscription plan to get access
Go to Dasboard
DATA &
TECHnologies
IndicatorEdge
‍
BackTestEdge
‍
Other Tools
‍
DataEdge API
RESEARCH
reports
Research Solution
‍
Reports Library
‍
actionable
Strategies
Trading Strategies
‍
Smart Stock Scanner
‍
FREE
RESOUrCES
Simple Backtest
Calculator
Simple Seasonality
Calculator
The Kelly Criterion
Calculator
Sentiment Geo Map
‍
Public Research Reports
‍
Free Webinar
COMPANY
‍
About
‍
Meet our Team
‍
In the News
‍
Testimonials
‍
Client Success Stories
Pricing
Bundle pricing
‍
Announcements
‍
FAQ
© 2024 Sundial Capital Research Inc. All rights reserved.
Setsail Marketing
TermsPrivacyAffiliate Program
Risk Disclosure: Futures and forex trading contains substantial risk and is not for every investor. An investor could potentially lose all or more than the initial investment. Risk capital is money that can be lost without jeopardizing ones’ financial security or life style. Only risk capital should be used for trading and only those with sufficient risk capital should consider trading. Past performance is not necessarily indicative of future results.

Hypothetical Performance Disclosure: Hypothetical performance results have many inherent limitations, some of which are described below. No representation is being made that any account will or is likely to achieve profits or losses similar to those shown; in fact, there are frequently sharp differences between hypothetical performance results and the actual results subsequently achieved by any particular trading program. One of the limitations of hypothetical performance results is that they are generally prepared with the benefit of hindsight. In addition, hypothetical trading does not involve financial risk, and no hypothetical trading record can completely account for the impact of financial risk of actual trading. for example, the ability to withstand losses or to adhere to a particular trading program in spite of trading losses are material points which can also adversely affect actual trading results. There are numerous other factors related to the markets in general or to the implementation of any specific trading program which cannot be fully accounted for in the preparation of hypothetical performance results and all which can adversely affect trading results.

Testimonial Disclosure: Testimonials appearing on this website may not be representative of other clients or customers and is not a guarantee of future performance or success.