Monday Color - A Month Of Swings, Economic Uncertainty, Sectors, Scramble For Protection

Here's what's piquing my interest as stocks swing wildly from their weekend lows.
Quite A Month
We seem to be on track for another whipsaw, as markets try to recover from conflicting messages over the weekend, following a rocky end to the week.
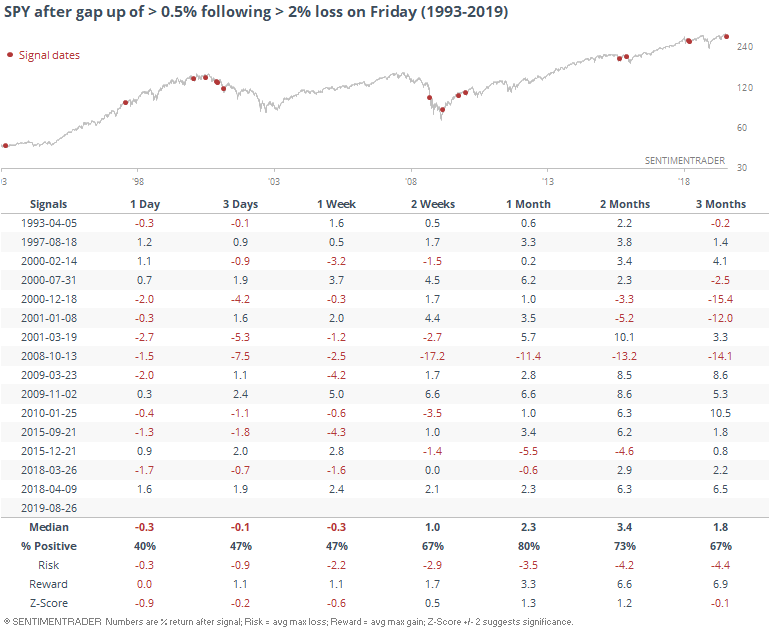
Price patterns probably mean less now than they ever have before, so strictly "for what it's worth" here is how SPY behaved following Monday morning gaps up after a big loss on a Friday. A little weak right away, but good 1-month returns.
It's not hard to see why a lot of sentiment gauges are coming down quickly - investors do not like uncertainty, and that has unquestionably been spiking (see below).
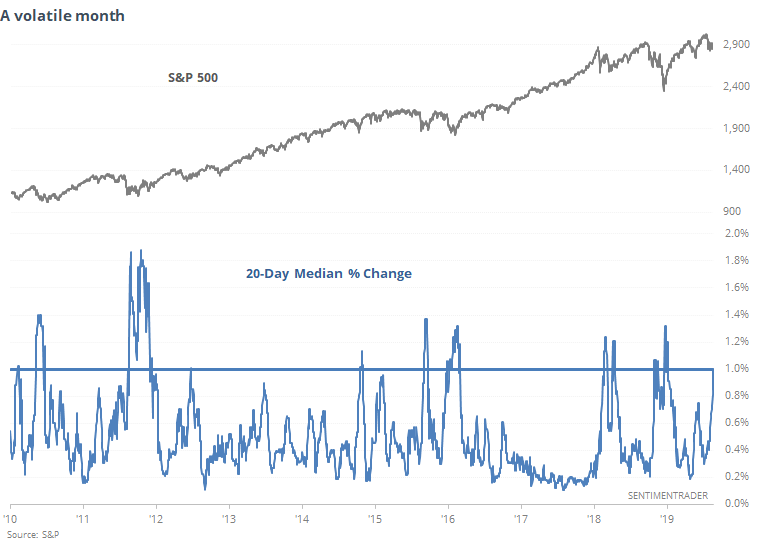
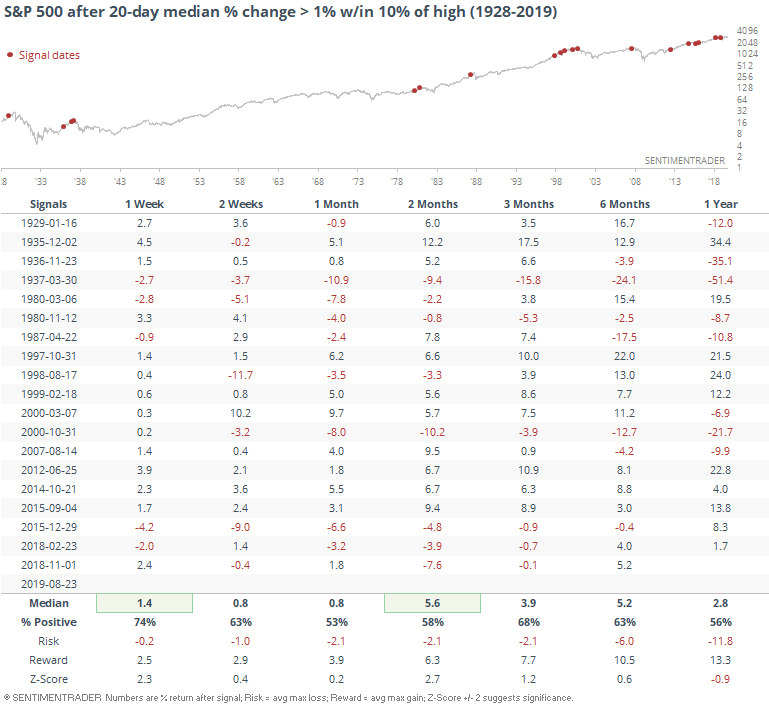
As a result, stocks have been gyrating wildly. On an average day over the past month, the S&P 500 has changed value by 1%, which is extremely high since the financial crisis.
That's pretty remarkable since the S&P was sitting at a high about 20 days ago. It went from one extreme to the other, in almost record time. Other times it swung from a multi-year high to median daily change of 1%, typically didn't precede a major decline, other than in the 1930s.
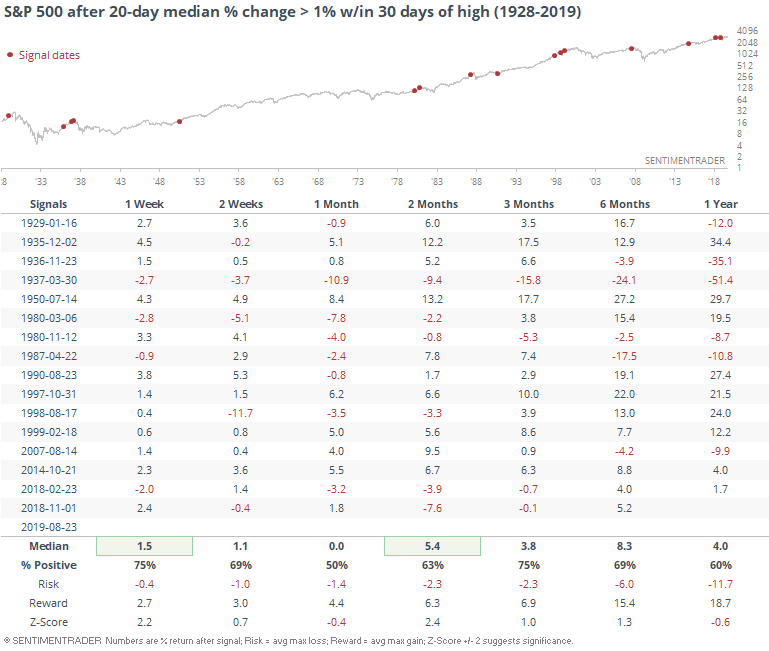
It didn't change much if we look at the magnitude of the decline instead of how long it took. These are the time it triggered when the S&P was still within "pullback" territory.
About That Uncertainty
Because of the rapid policy changes, people aren't quite sure what to think about economic prospects in the weeks and months ahead. It's no surprise, then, that uncertainty surrounding the administration's policies has spiked to an unusually high degree.
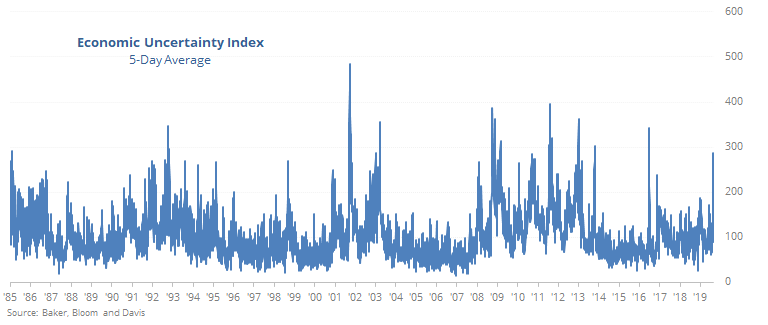
According to a Baker, Bloom & Davis index, it's now about 2.5 times the average over the past 30 years.
Per Bloomberg:
"The Baker, Bloom and Davis daily news-based Economic Policy Uncertainty Index is based on newspaper archives from Access World New's NewsBank service. The NewsBank Access World News database contains the archives of thousands of newspapers and other news sources from across the globe. While NewsBank has a wide range of news sources, from newspapers to magazines to newswire services, analysis is conducted using only US newspaper sources. These newspapers range from large national papers like USA Today to small local newspapers across the country. The index is constructed based on the number of articles that contain at least one term from each of 3 sets of categories. The first set is economic or economy. "
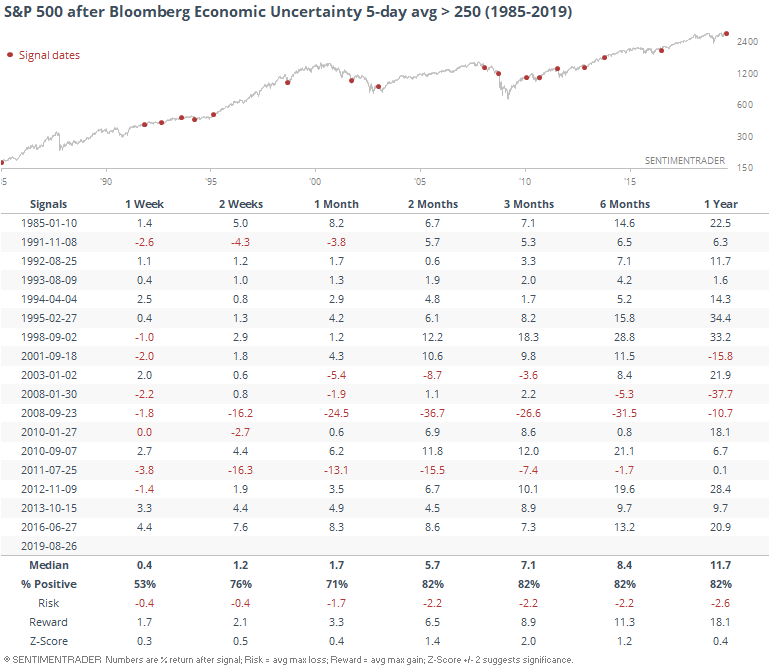
A spike in uncertainty preceded major declines in the S&P 500 in 2008 and 2011. But other than that, it was much more of a buy signal than a sell.
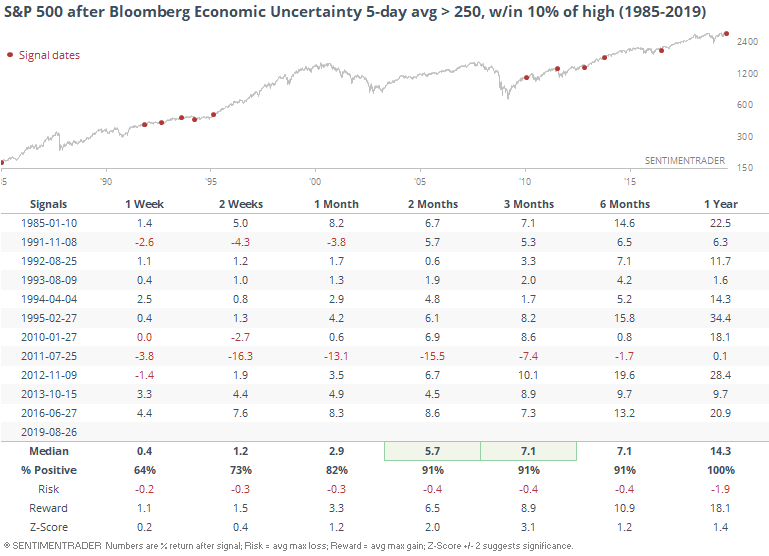
If we filter the table to only include times when uncertainty was likely high due to non-market factors, roughly defined as signals triggering when stocks were still relatively close to their peak, then forward returns were quite a bit better, though that instance from 2011 is still there.
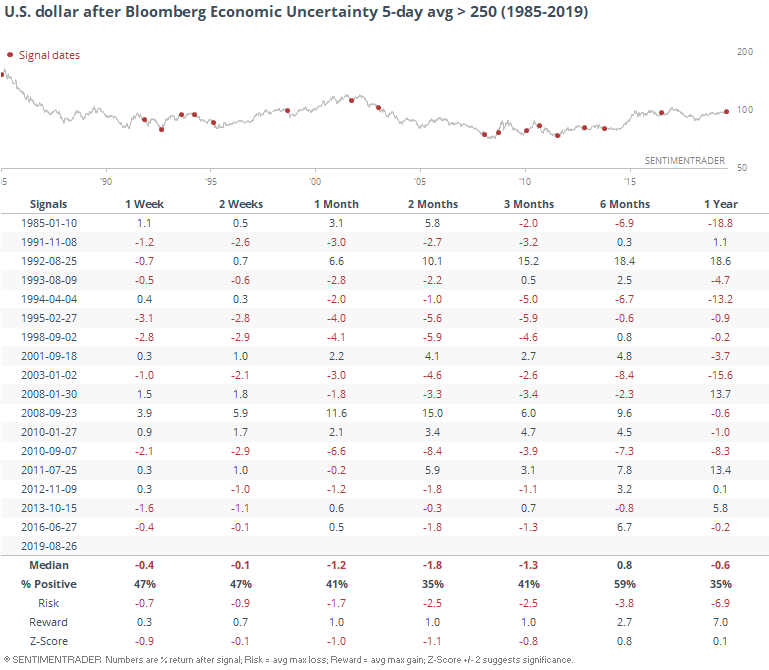
Removing the filter and looking at all the signals again, it was not an especially good sign for the dollar.
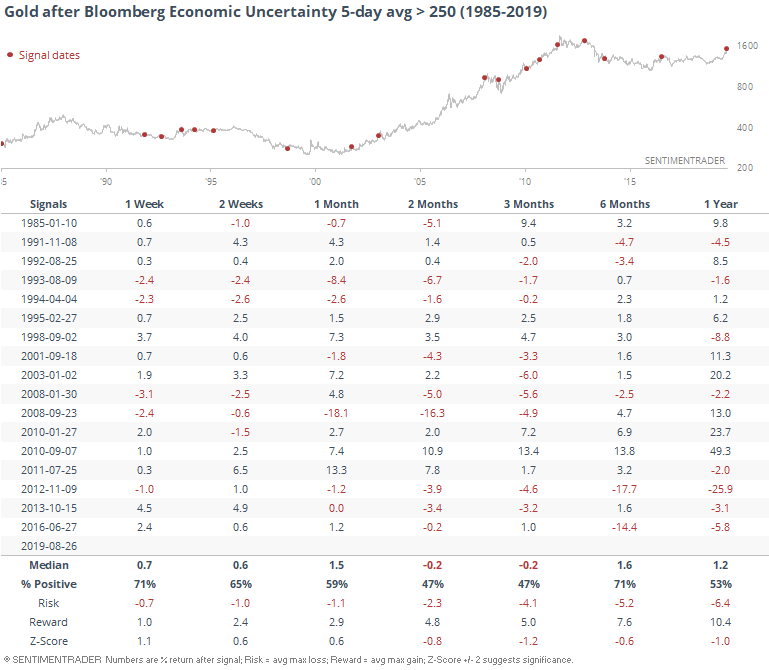
Gold did okay, maybe not as well as one would think.
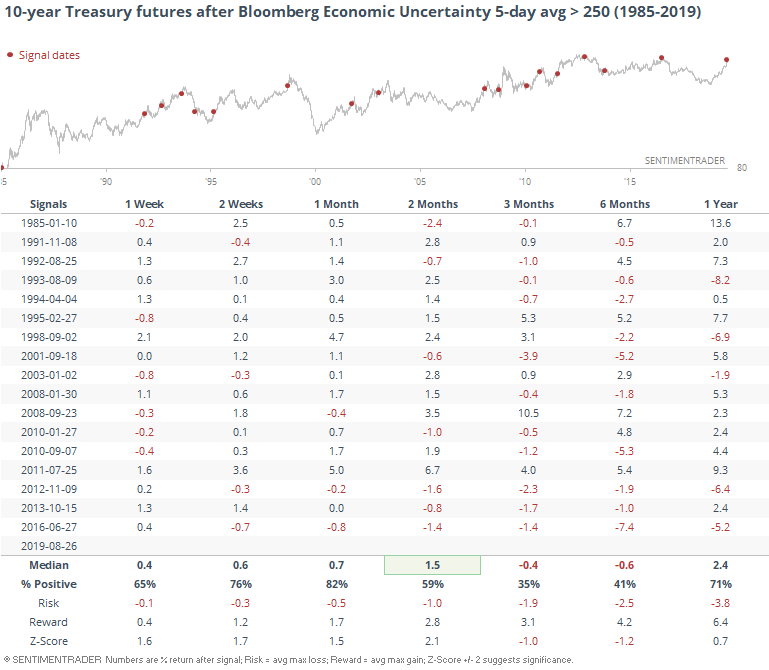
Bond prices did well short-term, but weakened over the next 3-6 months.
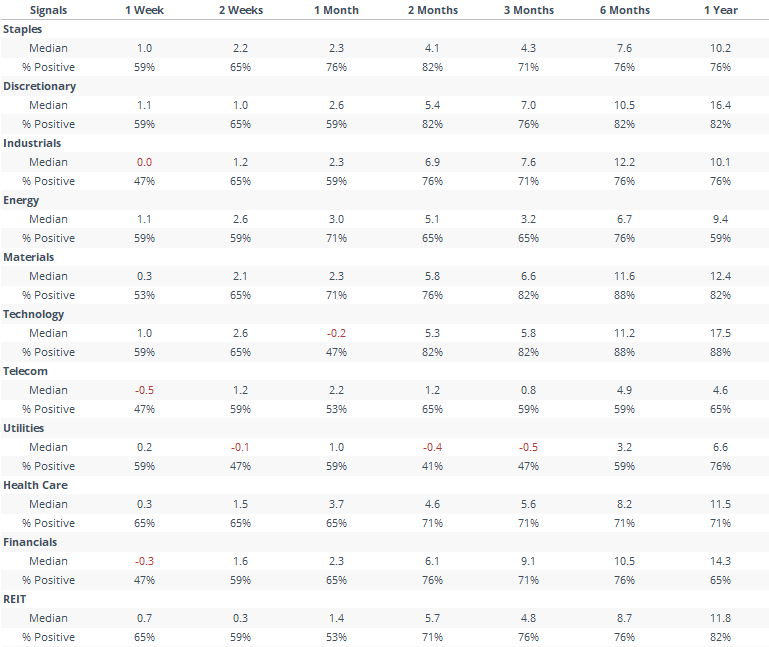
Sector returns weren't too consistent, with some of the more defensive groups doing better shorter-term, but sectors like tech and discretionary giving better medium- to long-term returns.
Sectors
Despite the heavy losses on Friday, there weren't really any notable new extremes among the breadth metrics we watch. About the only one was in basic materials, where more than 30% of stocks hit a fresh 52-week low. That's high.
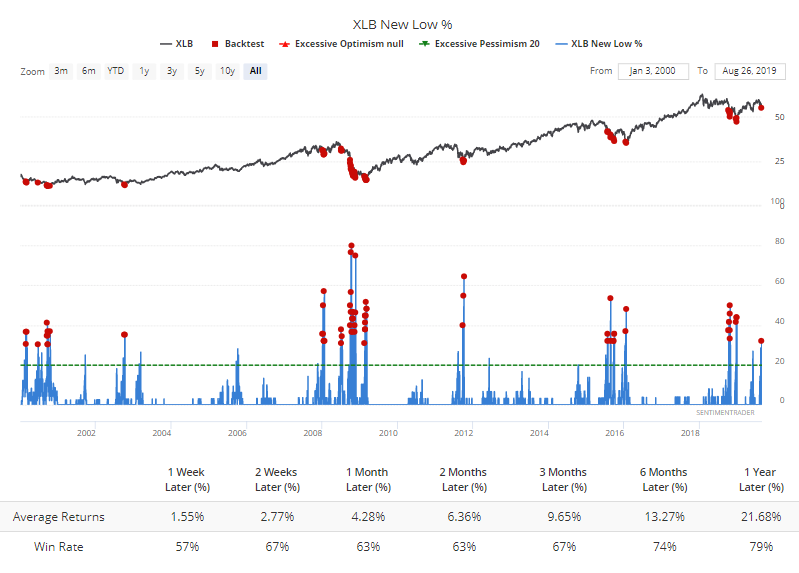
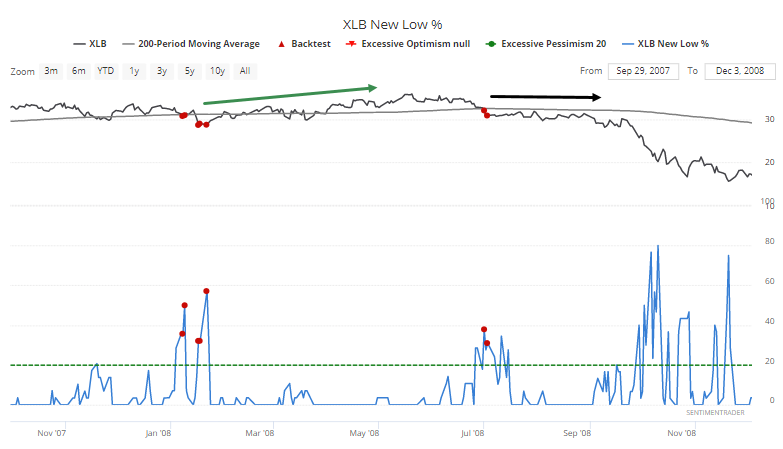
The only other times it triggered when XLB was trading below its upward-sloping 200-day average were in 2008. Both preceded a stalling out of the selling pressure for the next couple of months, but not major lows.
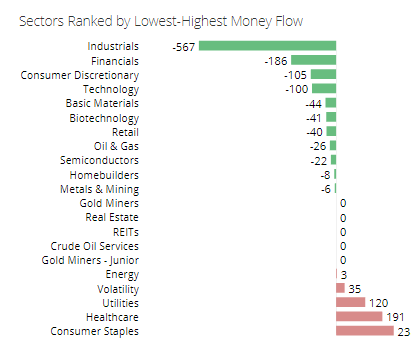
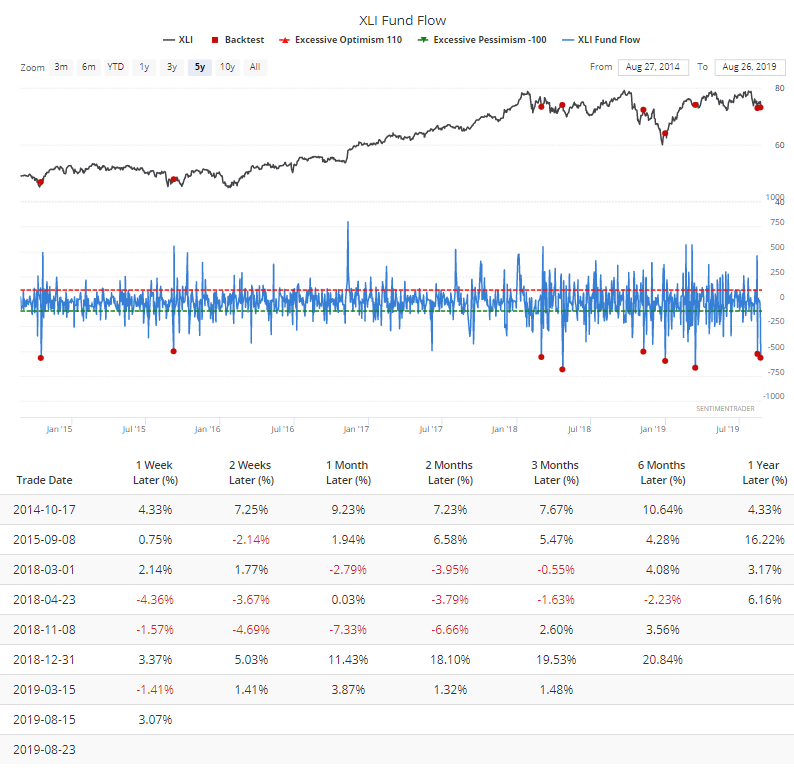
The trade worries caused investors to pull out of industrial stocks in particular. XLI lost more than $500 million in assets on Friday alone.
While significant, such a large outflow led to mixed returns for the fund in the past 5 years.
Extreme Anxiety
If you looked at the list of extreme indicators over the weekend, there were a few new ones that were showing heavy pessimism (3 green bars).
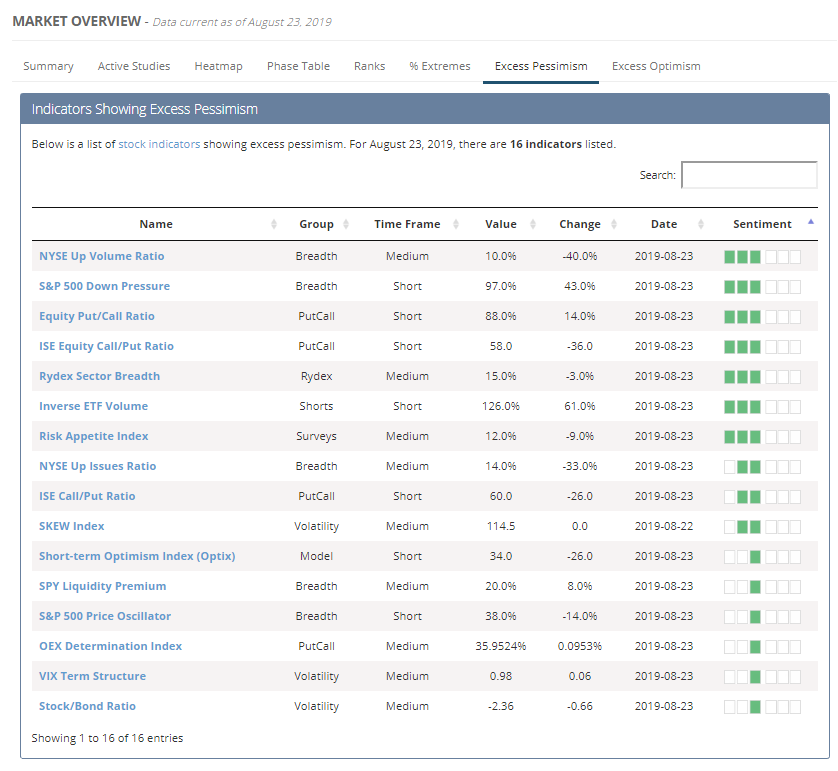
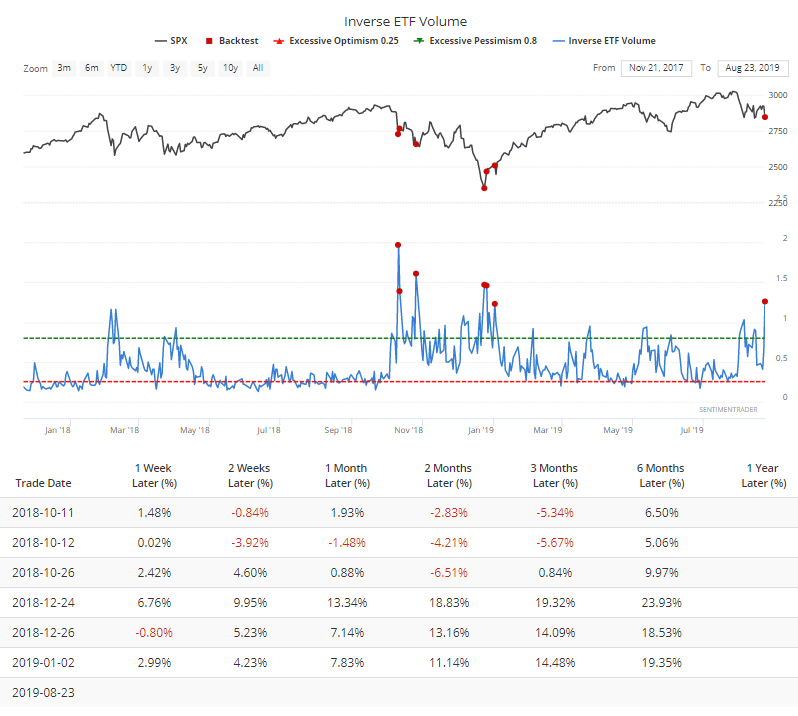
Among them, investors rushed into inverse ETFs on Friday to protect against any potential downside this week. They accounted for more than 1.2% of total NYSE volume, one of the largest amounts in history. The others all triggered last October or December (or right away in January).
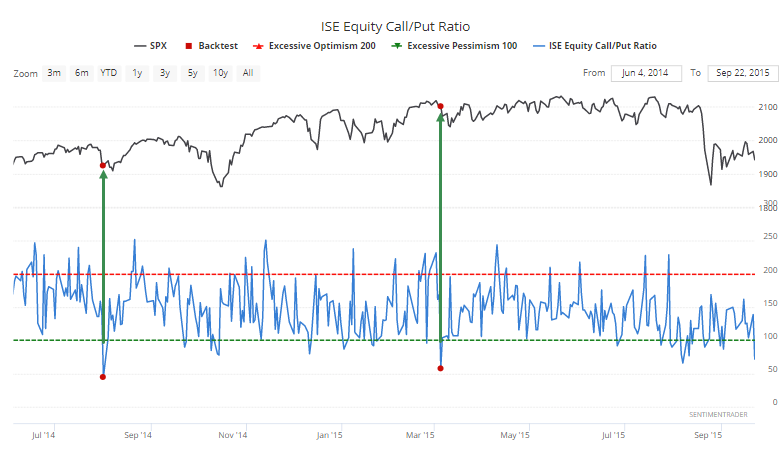
On the ISE exchange, options traders bought only 58 calls for every 100 puts, among the most extreme amounts of put buying in the data's 12-year history. The only dates with less call buying triggered in 2014 and 2015, with mixed results.
Over the past 3 sessions, this indicator is at an all-time low. Not a lot of interest among options traders in speculating on a rebound.
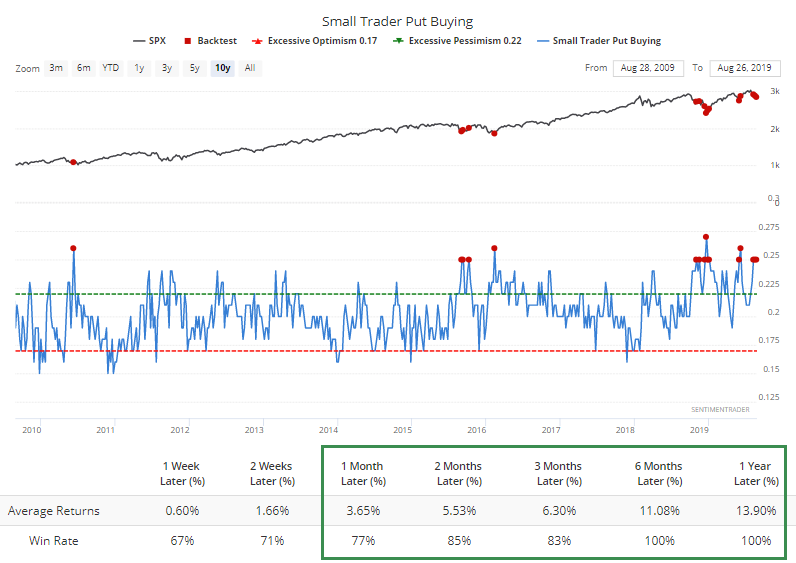
That *seems* like it should be a positive sign, but other options indicators aren't quite confirming it. The total and equity ratios on the CBOE are very high, and that's good, but small options traders haven't pulled in their horns much - they're still buying too many calls.
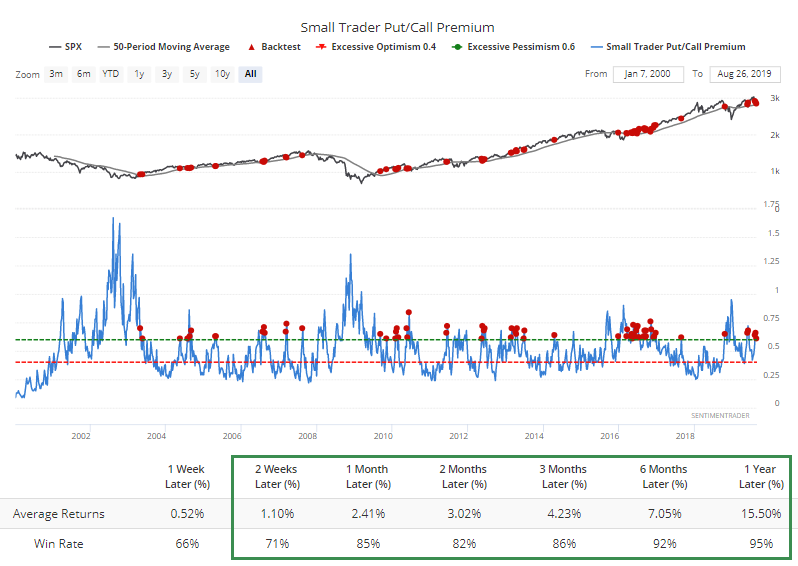
It would be nice to see that figure drop, but at least they're buying a lot of protective puts. For the last two weeks, they've spent at least 24% of their volume on put options. That's among the highest levels since the financial crisis.
They've also been paying up for the right to buy those puts, spending a lot on premiums despite the S&P 500 still holding above its 50-week moving average.