
Momentum Traders' Massive Loss

This is an abridged version of our recent reports and notes. For immediate access with no obligation, sign up for a 30-day free trial now.
Massive momentum move
On Monday, many momentum traders likely had their worst day in a decade. Stocks that showed the best gains year-to-date suffered some of the worst losses, and stocks down the most so far in 2019 showed some of the best gains. This was the largest one-day shift in momentum since 2009, and a ratio based on long/short momentum is now down 10% from its peak.
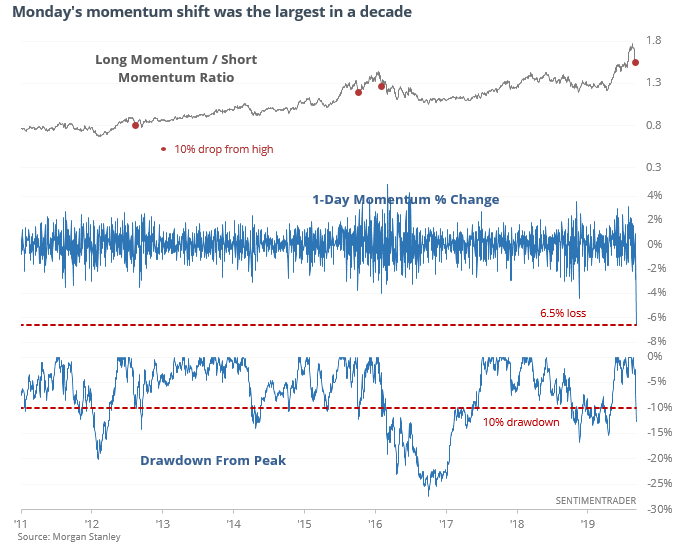
This kind of shift in momentum has triggered 10 other times over the past 20 years. For the broader market, returns were mixed going forward, which kind of destroys the narrative that will certainly be bandied about this this will trigger a market crash due to exponential losses in leveraged long/short funds. Two weeks later, the S&P was higher all but once, but after that, it was a lot more mixed.
The worst month
September has a bad reputation as being the worst for stocks. The media has been pounding on this theme for the past week.

But context seems to matter. In years when the S&P 500 was up more than 10% and within 2% of its high through the first week of September, the rest of the month usually did fine (October was more of a worry). We can see the last 4 occurrences below.
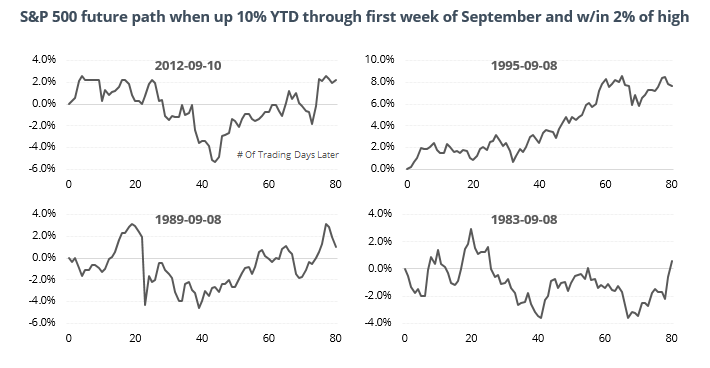
September was much worse during years when stocks were already showing losses.
“Safe” stocks are expensive
After their recent surge, the trailing P/E ratio for the S&P 500 utilities sector is above 20 and the forward ratio is above 19, both the highest since 1990.
After the 6 other times the sector was almost this highly valued, utilities dropped at least 10% each time.
Bear Market Probability
Goldman Sachs has a "Bear Market Probability Model" that uses 5 fundamental inputs - the U.S. Unemployment Rate, ISM Manufacturing Index, Yield Curve, Inflation Rate, and P/E Ratio. The model is constructed by looking at each input as a percentile against its historical readings. The higher the Bear Market Probability Model, the closer the economy is to "as good as it gets".
The problem with high Bear Market Probability readings is that they can stay high for years before a bear market/recession begins. A more timely signal is when the Bear Market Probability Model starts to fall significantly (trend downwards) from a high.
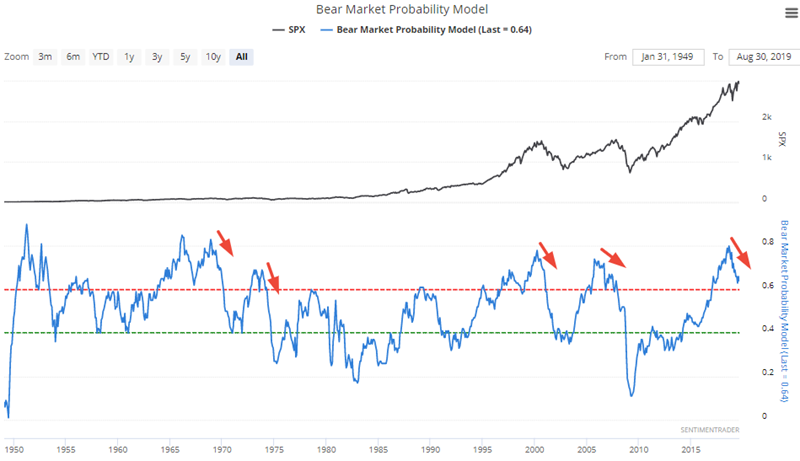
The model has now fallen more than -12% over the past 5 quarters. In the past, this wasn't a great long term sign for the stock market.
- The last 4 signals came within the worst bear markets from 1950-present
- 1966-1967 saw an economic slowdown that was averted by increased Vietnam war spending
- 1952 was followed by a recession 1.5 years later