
Mom-and-pop stay on the sidelines

There is a chorus of opinion that stocks couldn't possibly have formed an important bottom in March because we never saw peak pessimism, whatever that means. Usually, as evidence, the proclamations include a chart of some random, isolated sentiment indicator.
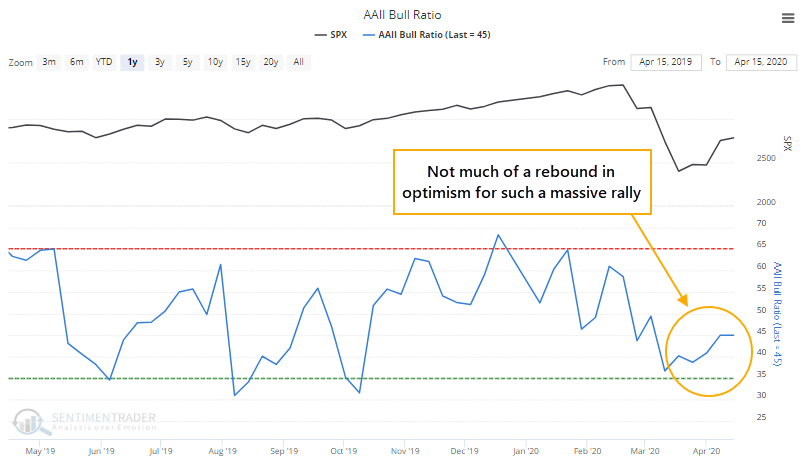
No single indicator is perfect, and there is usually something that doesn't fit with the others. One of the measures that didn't really show much pessimism near the low in March was the survey of individual investors from AAII. It has a lot of weaknesses as the arbiter of "sentiment," but gets a lot of attention in the media as a reflection of mom-and-pop attitudes.
During March, the Bull Ratio (Bulls / (Bulls + Bears)) fell below 37%, enough to show some pessimism but not to the extremes seen at most prior lows. But here's the curious thing - despite a massive rally in stocks, folks are still pessimistic.
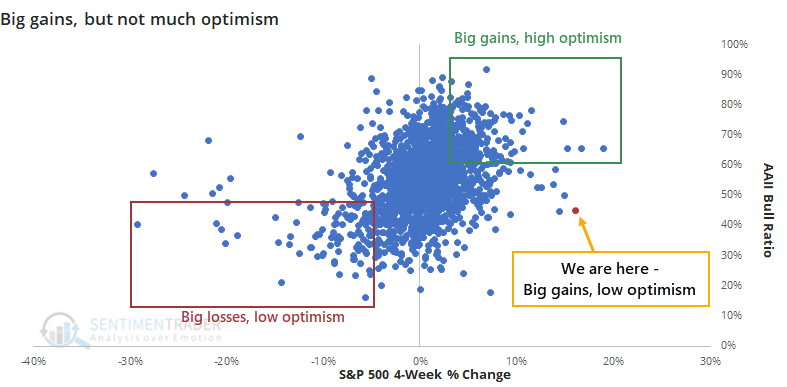
For the first time in the survey's history, dating to 1987, the S&P 500 rallied more than 10% over the past 4 weeks, and the Bull Ratio is still below 50%. Also for the first time, the S&P rallied more than 10% and the Bull Ratio increased by less than 5%. There is usually much more of a correlation between price gains over the past 4 weeks and the Bull Ratio.
We should not automatically assume this is a good thing. A rising market needs rising optimism, as long as it doesn't get out of hand. So let's relax the parameters a bit and see if we get any precedents.
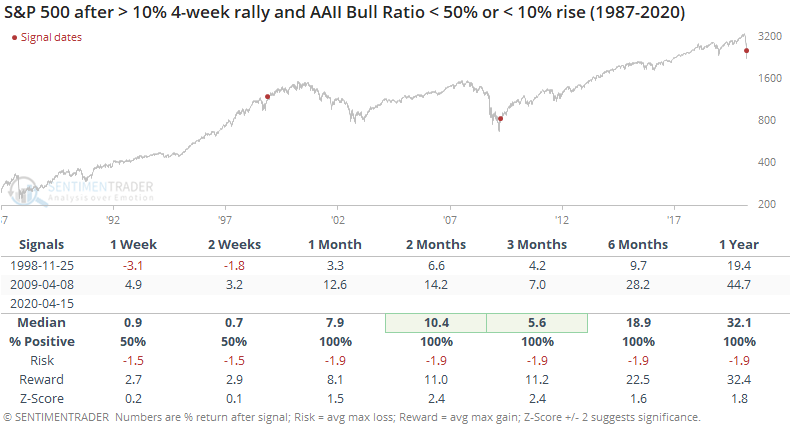
There were only two weeks when conditions were even remotely similar. In the four weeks leading up to late November 1998, stocks surged but the AAII survey showed only a modest rise in the Bull Ratio. And as stocks bottomed in 2009, the initial surge was greeted with a collective shrug of the shoulders by these investors, as the Bull Ratio stayed below 50%. Both led to large gains going forward.
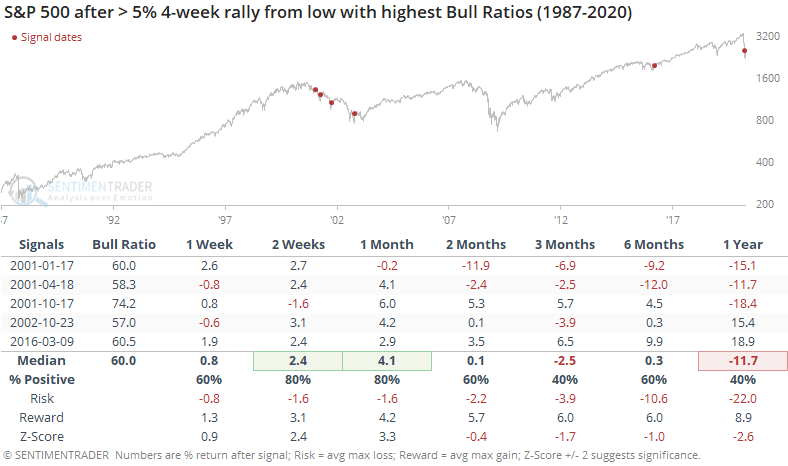
If we really relax the parameters, we can look at 4-week rallies of at least 5% from a low, looking for times with the least amount of optimism from individual investors.
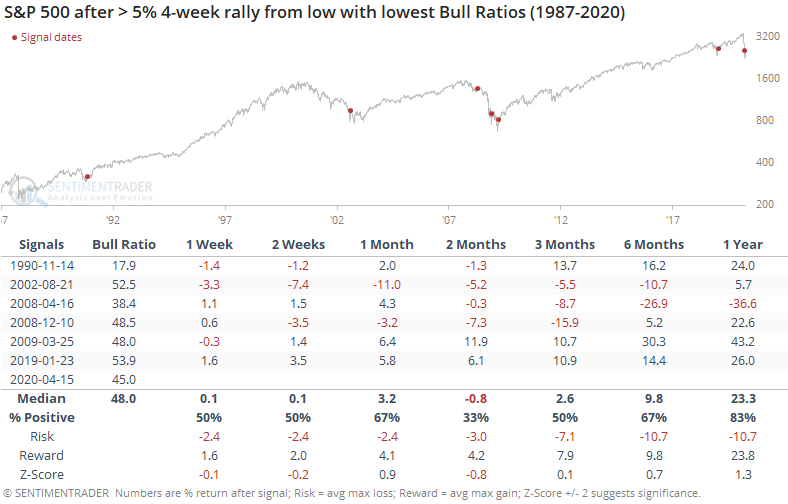
Those led to some choppy action over the next few months as stocks tried to find their footing, and it was a woeful signal early in 2008, but otherwise, they preceded mostly positive longer-term returns.
We can contrast this to those rallies that saw the biggest jumps in optimism from these folks.
These showed better gains shorter-term, but worse longer-term returns as they mostly triggered during false starts following the pricking of the internet bubble.
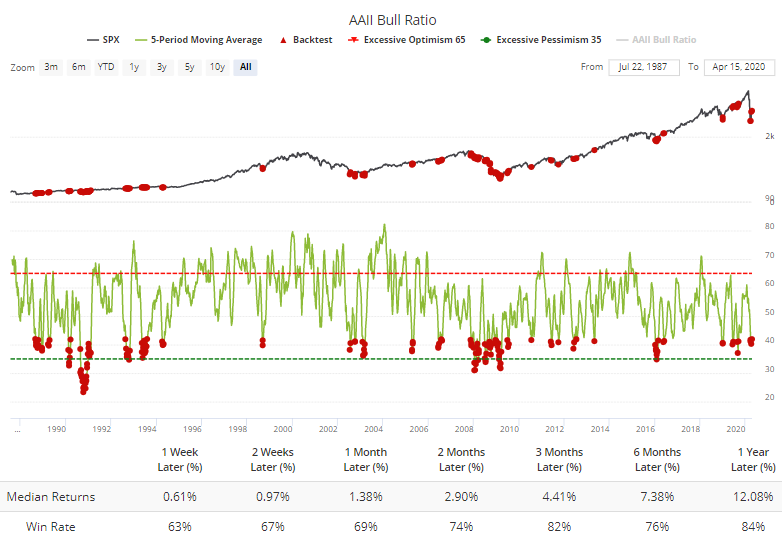
Even after this jump from the lows, the 5-week average of the Bull Ratio is still below 42%. The Backtest Engine shows mostly positive returns following such subdued optimism.
Over the next year, almost all of the losses were confined to the signals from the spring and summer of 2008. All of the other dates either showed gains or very small losses.
This survey never really reached a true extreme of pessimism, but it has been low enough, for long enough, that it has had a strong tendency to lead to medium- to long-term gains. The fact that individuals have not become much more bullish despite a huge rally isn't necessarily a positive, and shorter-term it's probably more of a negative than anything. But it's a sign that longer-term returns have a better probability of being positive.