Minutes Digest for Dec 18 2020

QQQ is being engulfed
- Published:
2020-12-18 13:52:39 - Author: Jason Goepfert
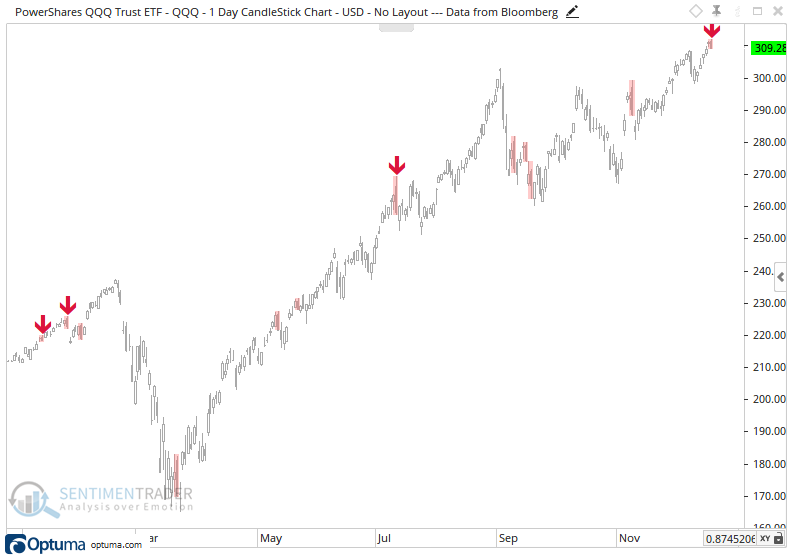
A rejection of the intraday rally has left some reversal patterns on the charts if we hold into the close. For the Nasdaq 100 trust, QQQ, it's carving out what technicians consider one of the more ominous patterns, a bearish engulfing bar.
From Investopedia:
"A bearish engulfing pattern is a technical chart pattern that signals lower prices to come. The pattern consists of an up (white or green) candlestick followed by a large down (black or red) candlestick that eclipses or "engulfs" the smaller up candle. The pattern can be important because it shows sellers have overtaken the buyers and are pushing the price more aggressively down (down candle) than the buyers were able to push it up (up candle)."
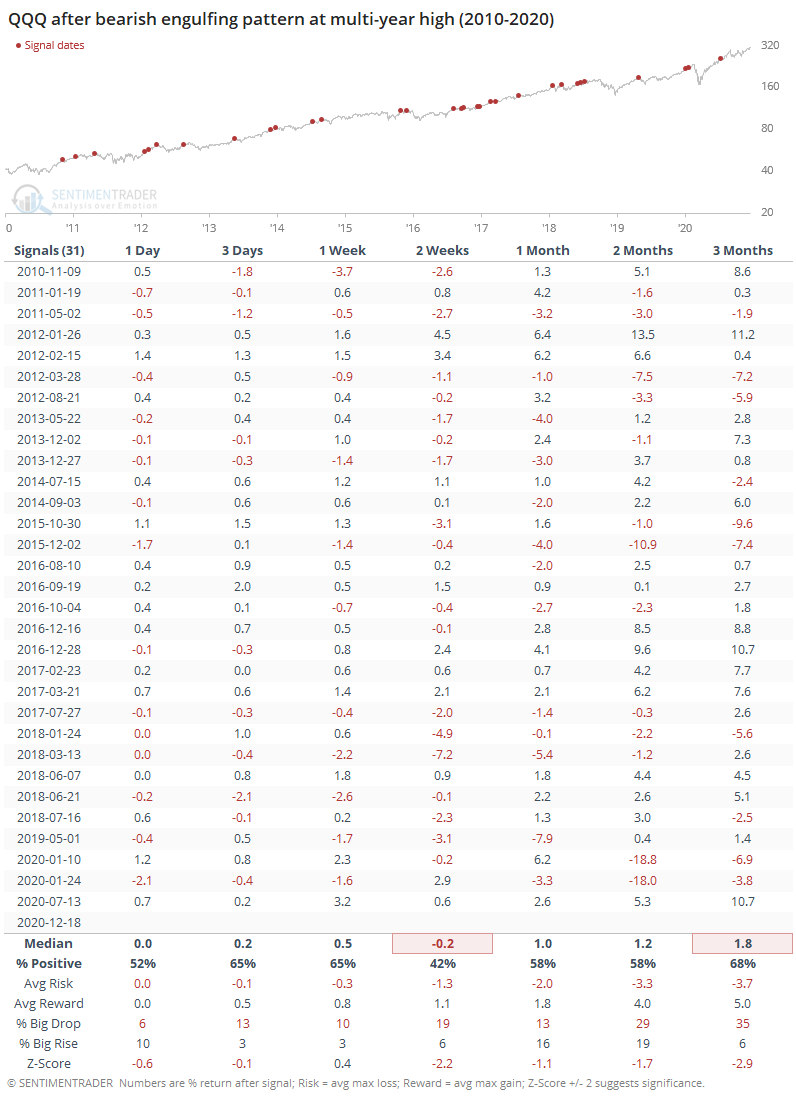
The chart below highlights these patterns, with the arrows indicating recent dates when it also triggered while QQQ had reached a multi-year high.
Since the 2009 low, this has triggered more than 30 times, and was relatively effective at preceding weakness over the next couple of weeks. Even up to 3 months later, average returns in QQQ were well below random.
One of the best runs for small stocks in 20 years
- Published:
2020-12-18 09:31:20 - Author: Jason Goepfert
The small-cap Russell 2000 is continuing its impressive run Friday despite broader weakness. If it holds up, this will be its 33rd consecutive day trading above its 10-day average.
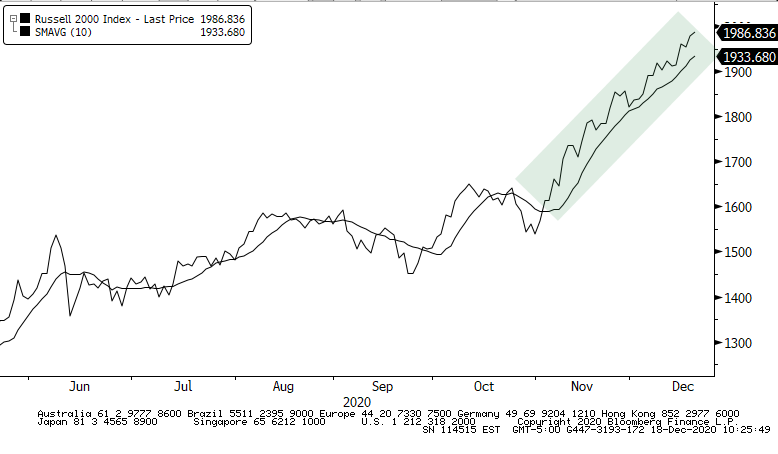
It's rare to see runs this long above such a short-term moving average. Because it's a shorter time frame, it hugs prices more closely, so it's easier for an index to gyrate above and below it. A run of 33 days is among the longest in 20 years.
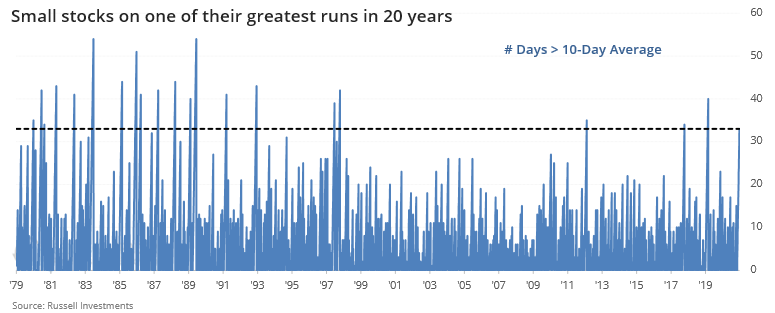
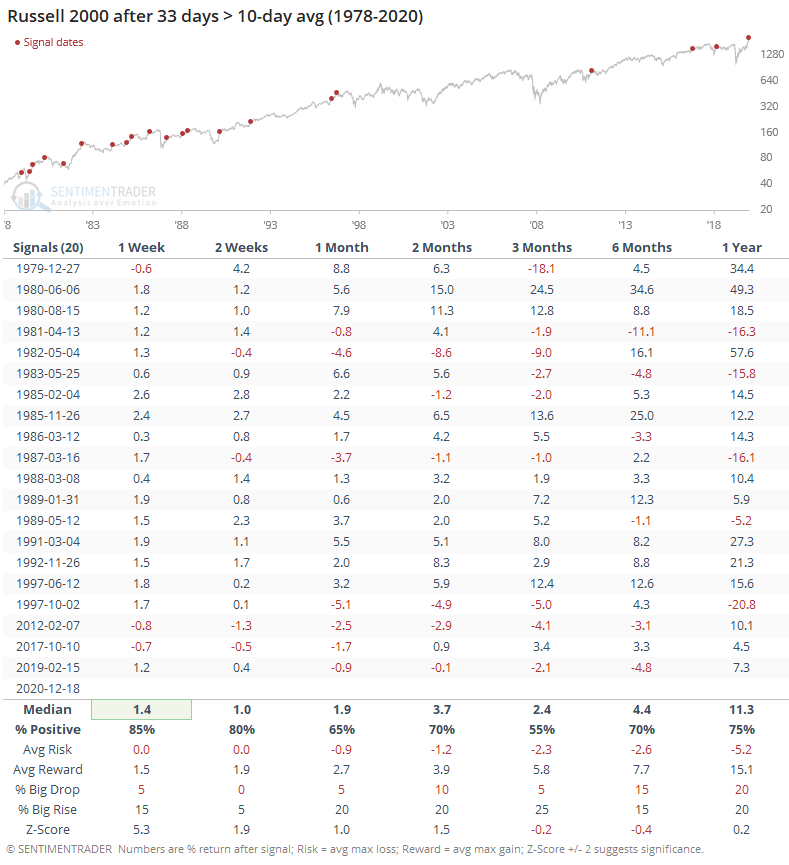
Momentum doesn't die easily, and that was the case here. The next 2-4 weeks tended to be good for the index, but over the next 3 months it settled back quite a few times.
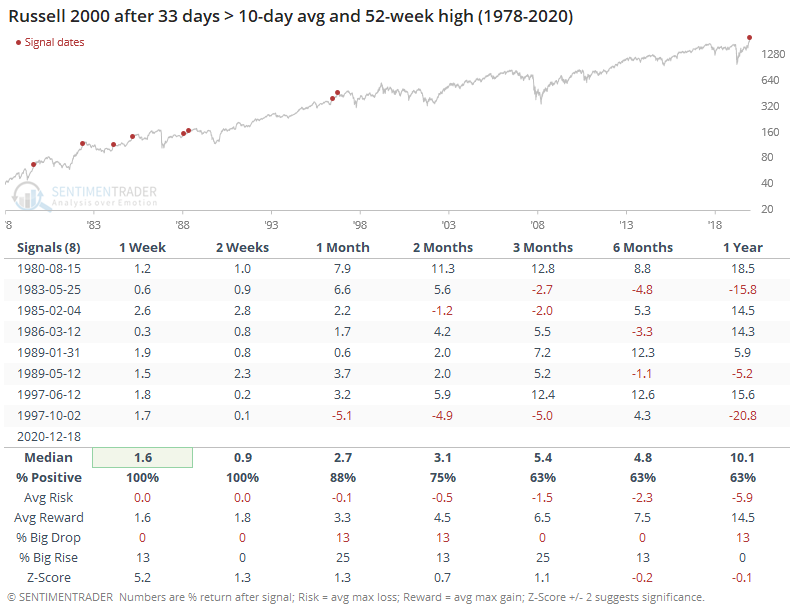
If the run coincided with a 52-week high, like now, then it was undefeated over the next couple of weeks.
By the time the Russell has (almost) doubled off of a low, it fell back over the next few months every time. Based on its current momentum, we might have a wait a bit to see if that tendency is going to come to fruition this time.
Tesla day
- Published:
2020-12-18 08:15:00 - Author: Jason Goepfert
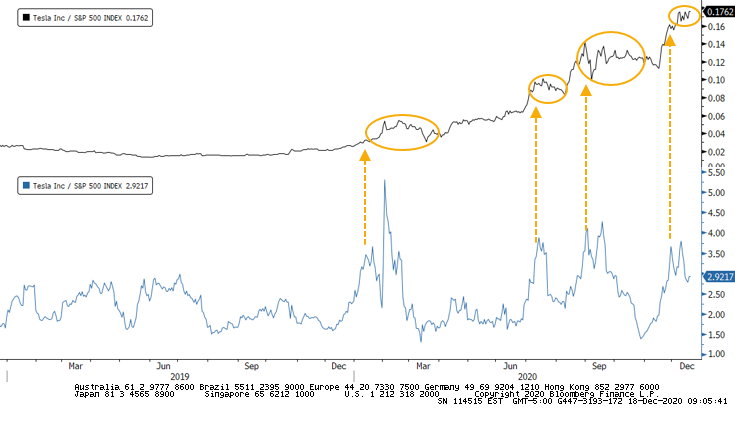
The addition of Tesla to the S&P 500 is one of the bigger events of the day as traders are anticipating massive flows not just in that specific stock, but reverberations throughout the market.
It's worth noting that we didn't see headlines like this when the stock got looked over at the previous index committee meeting.

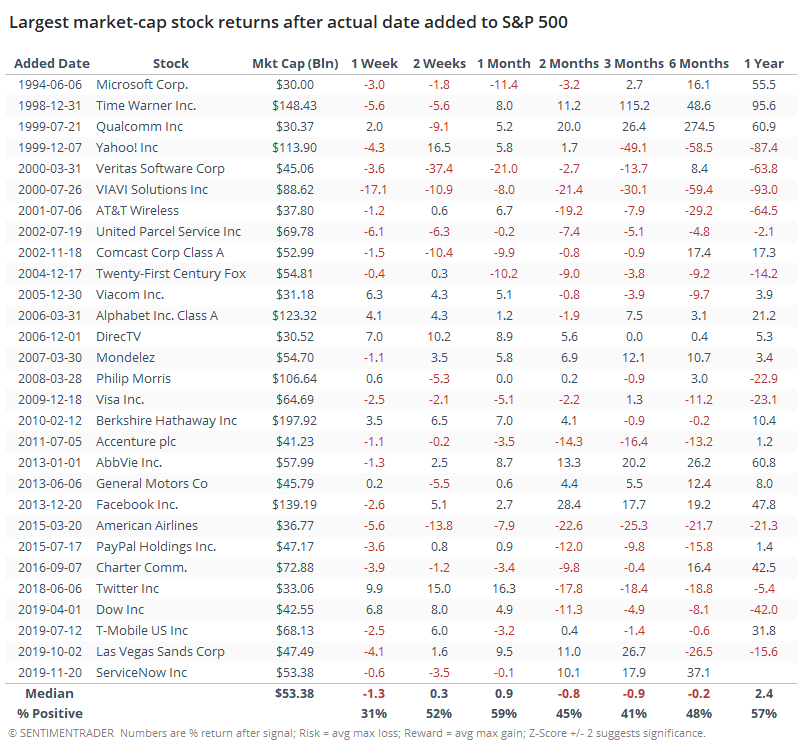
This is a good time to reiterate the table from one month ago when the Tesla addition was announced. When a big stock got added to the index, it had a strong tendency to rally after the announcement date. But after it actually became part of the index, returns were poor.
Another interesting wrinkle is in the options market. Currently, options on 10% out-of-the-money calls on Tesla are more than 3 times more expensive than equivalent out-of-the-money puts on the S&P 500. Traders are willing to pay a lot more for upside potential in TSLA than they are for protection against the S&P. Other times it was this high, the stock underperformed the index.