Minutes Digest for Dec 17 2020

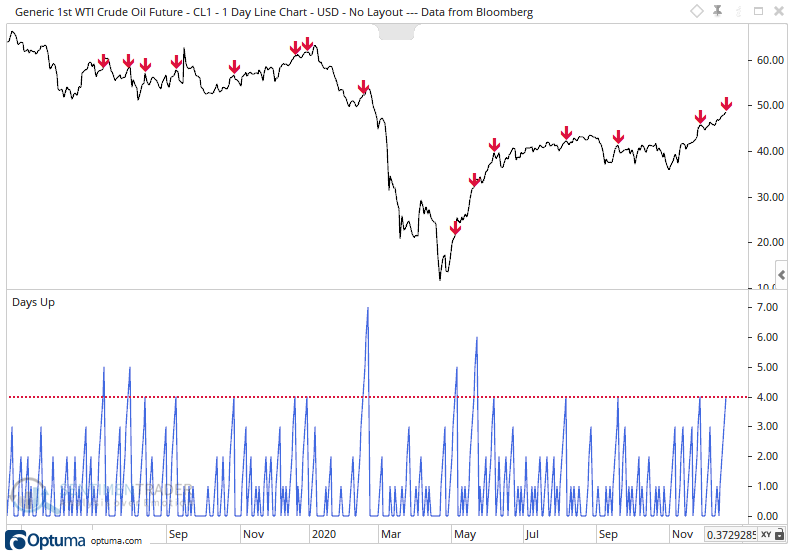
A crude streak
- Published:
2020-12-17 14:27:15 - Author: Jason Goepfert
Continuous crude oil futures put in their 4th straight day on Thursday, one of the longest streaks in recent years. It's been a bit tough for it to keep going, as evidenced by the reactions following those red arrows on the chart.
A potential saving grace is context. This string of gains is occurring as oil is sitting at more than a 50-day high, but still down more than 20% from its recent peak. The table below shows returns under similar conditions. Some scary losses in there, but mostly in the midst of longer-term recoveries.

Buyer indecision
- Published:
2020-12-17 13:15:45 - Author: Jason Goepfert
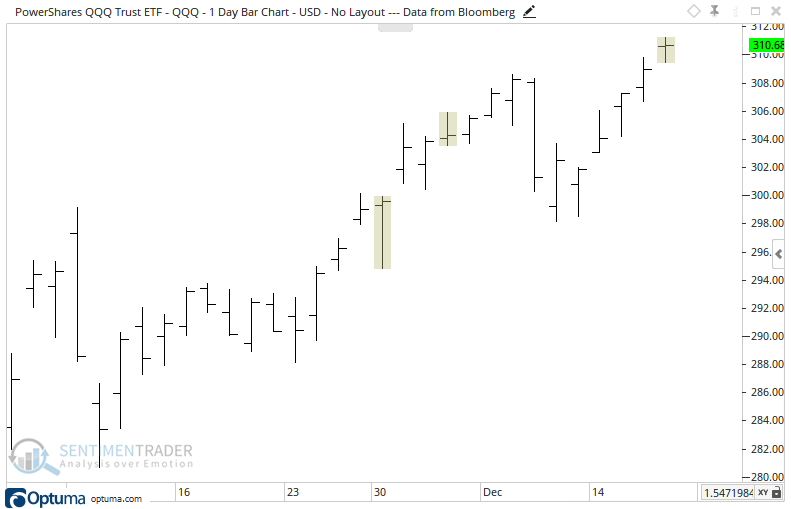
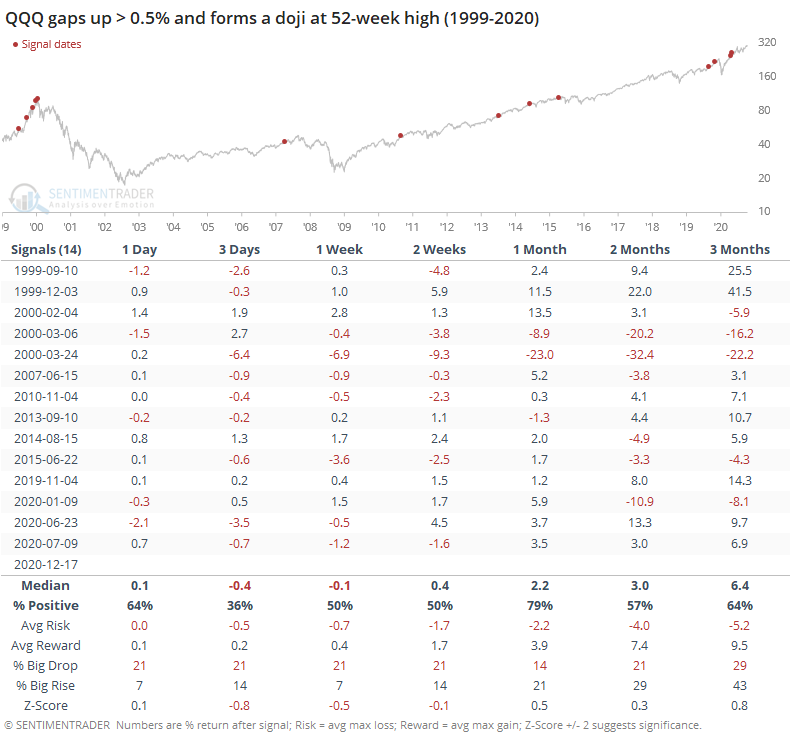
The Nasdaq 100 trust, QQQ, is forming a doji pattern after gapping up and hitting a new high.
From Investopedia:
"A doji candlestick forms when a security's open and close are virtually equal for the given time period and generally signals a reversal pattern for technical analysts. In Japanese, "doji" means blunder or mistake, referring to the rarity of having the open and close price be exactly the same."
It's been a short-term negative after other signals, but not much after the first week.
Bitcoin blastoff
- Published:
2020-12-17 11:17:41 - Author: Jason Goepfert
The primary crypto has soared again today. Even after what's been a volatile session, it's up well over 10% on the day and at an all-time high.
Other times it rallied at least 10% to a 1-year high, it tended to add to its gains short-term but had some medium- to long-term losses. None of this will matter to the HODL crowd, which seems to have found an ever-louder voice lately.
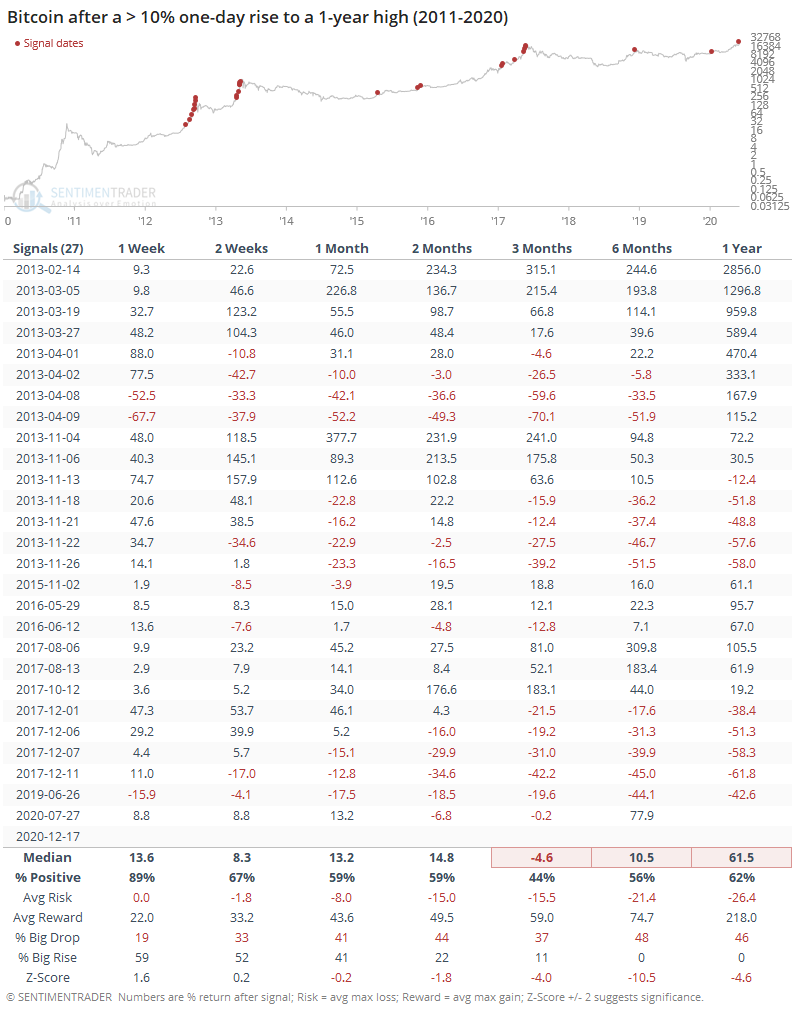
That risk/reward is absurd, highlighting just how volatile this thing can be. It's interesting to note the percentage of time that bitcoin showed a big drop as opposed to a big rise over the next 3-12 months.
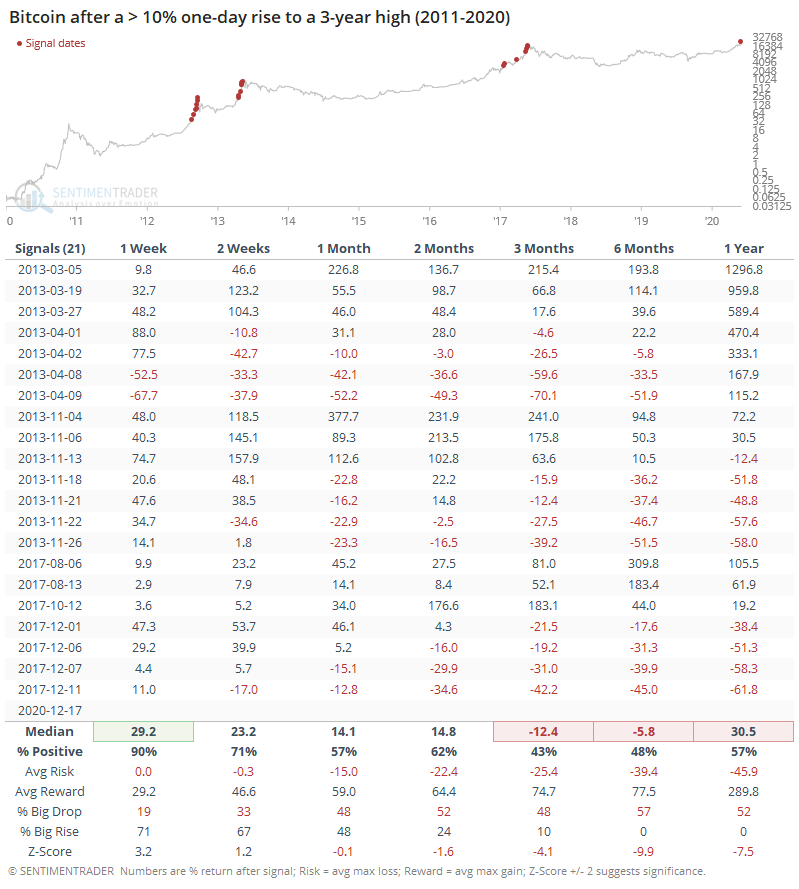
If we look at similar moves but require at least a 3-year high, then both tendencies were exacerbated (short-term follow-through, longer-term struggles).
Stretching the dollar
- Published:
2020-12-17 09:03:48 - Author: Jason Goepfert
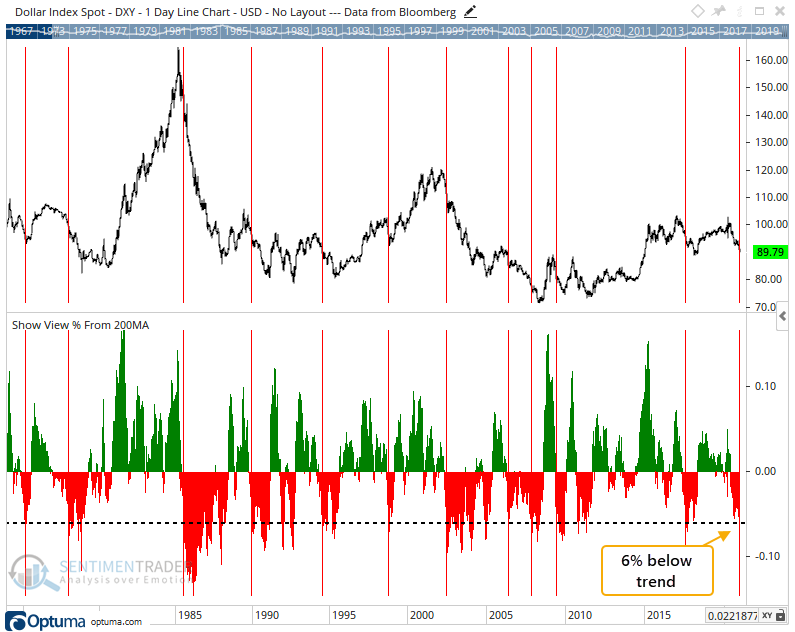
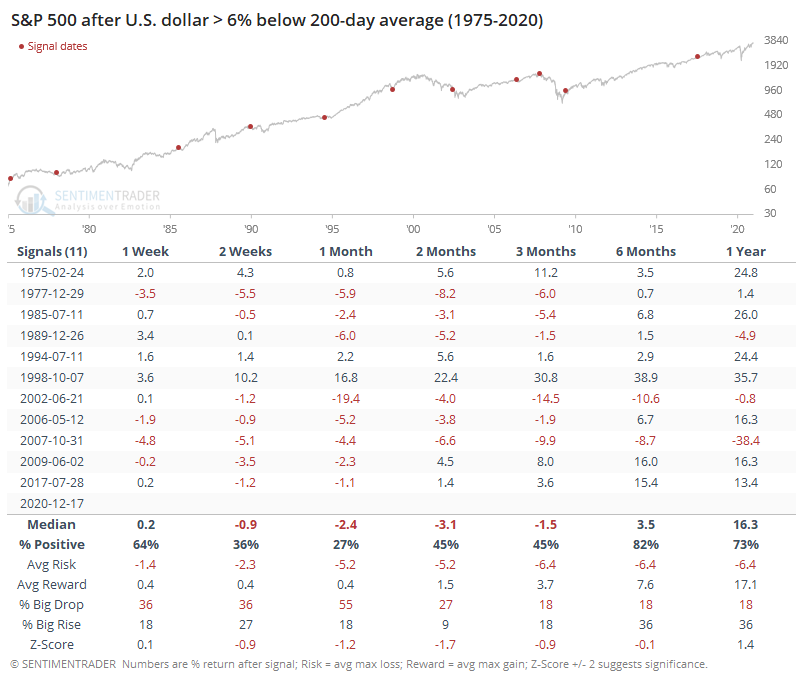
With more losses so far on Thursday, the buck has moved more than 6% below its 200-day average, one of its furthest deviations from trend in its history.
We've seen before, though, that trendy markets like currencies don't tend to react consistently to extremes like this, and that was the case for the dollar.
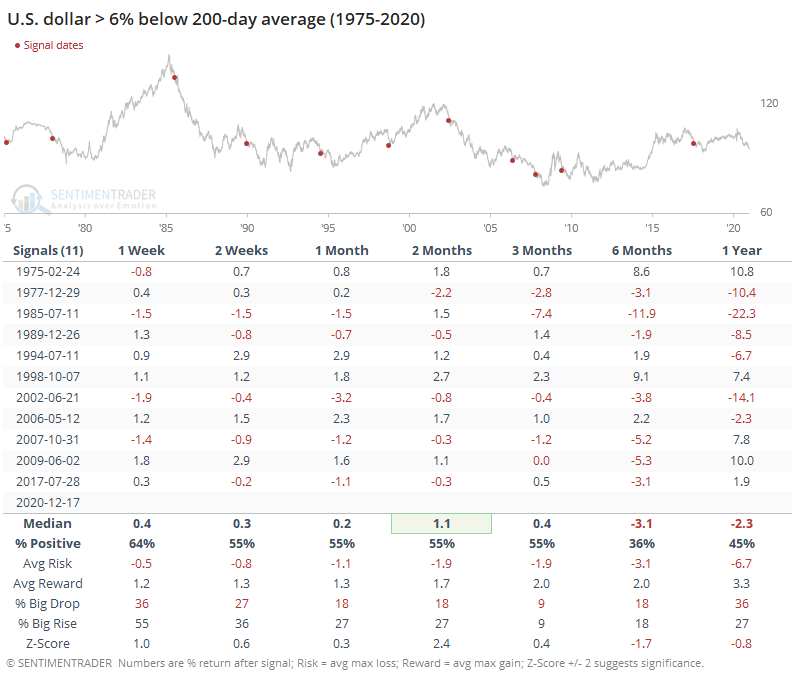
Interestingly, stocks didn't react all that well, either.
NOT the lowest put call ratio ever
- Published:
2020-12-17 08:17:41 - Author: Jason Goepfert
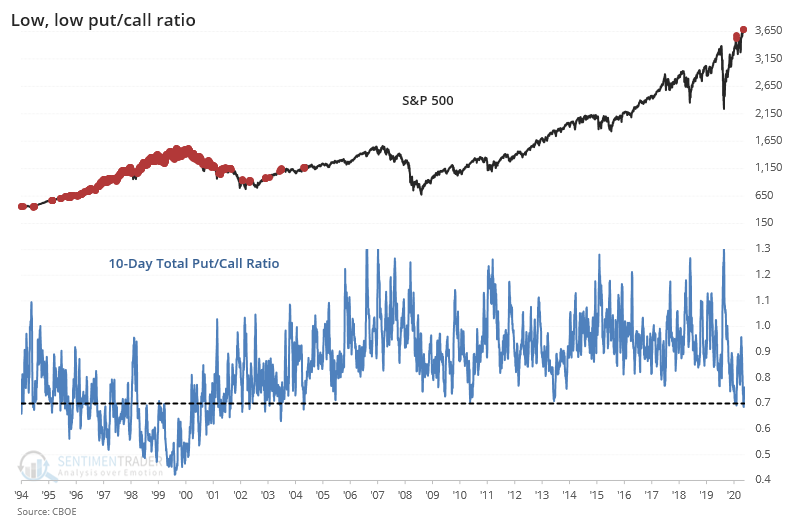
There has been quite a bit of chatter that we're seeing the lowest put/call ratios ever. Well, no. Based on the most accurate data we have, which looks at who is actually doing what, then yes it is. The problem is that the data ends in 2000, and it's definitely troubling.
But if we take a broader view and look at the total put/call ratio as calculated by the CBOE, then we're seeing a 15-year low, but not an all-time low.
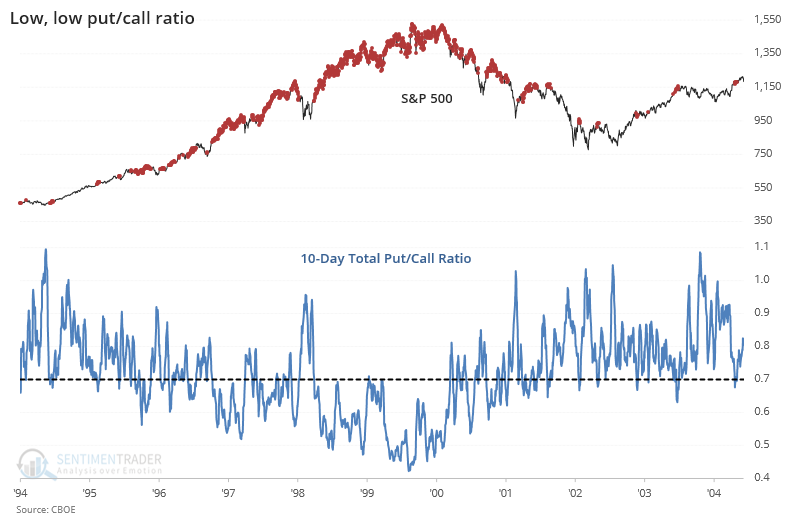
If we zoom in on that prior time period, we can see that it wasn't a big worry for stocks.
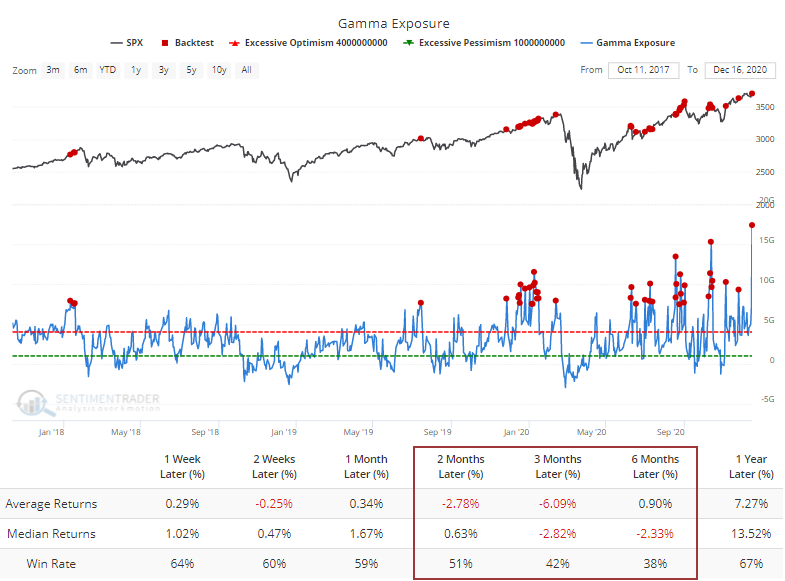
What is a big worry is that Gamma Exposure has skyrocketed again and just hit a record high. This is an estimate of how much dealers will have to sell of S&P 500 stocks for every 1% rise. When it's been above $7.5 billion, the S&P has struggled to hold its gains.
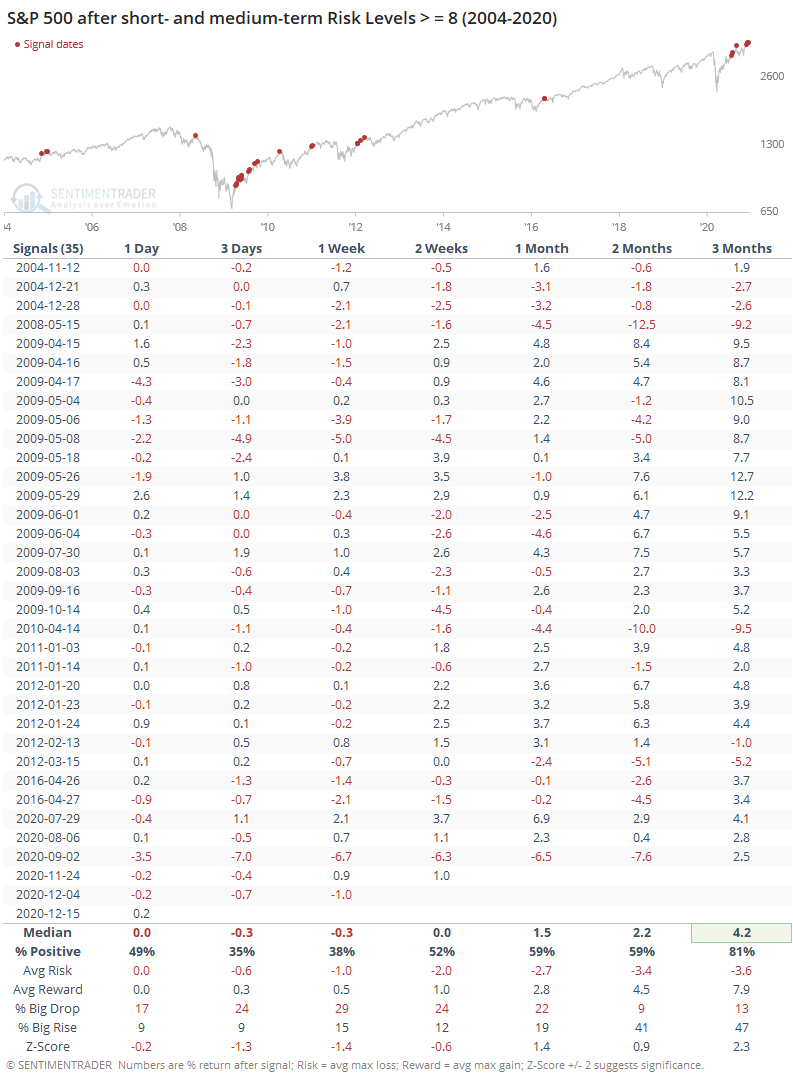
High short and medium risk
- Published:
2020-12-17 07:44:50 - Author: Jason Goepfert
We started calculating our Short- and Medium-Term Risk Levels in 2004, based primarily on sentiment, momentum, and trend, with some adjustments based on whatever studies are triggering at the time. It's relatively rare to see both of them at 8 or higher, which happened on Tuesday.
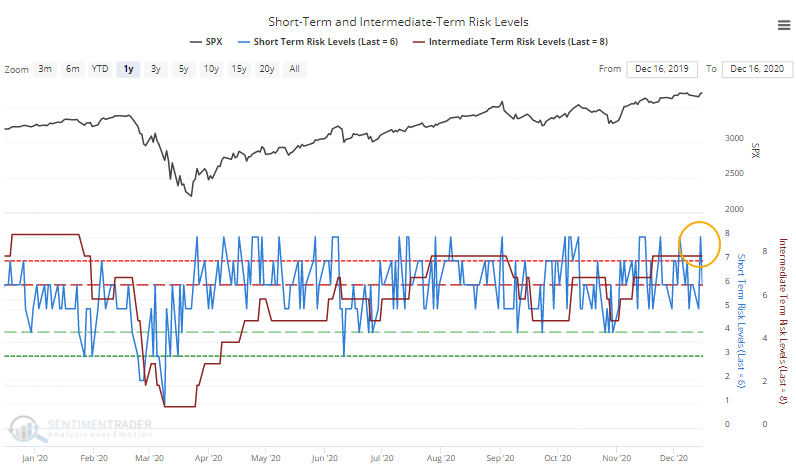
When both were at this high of a level, it's been tough for the S&P to hold its short-term gains.