Minutes Digest for Dec 15 2020

Fund managers vs insiders
- Published:
2020-12-15 12:45:33 - Author: Jason Goepfert
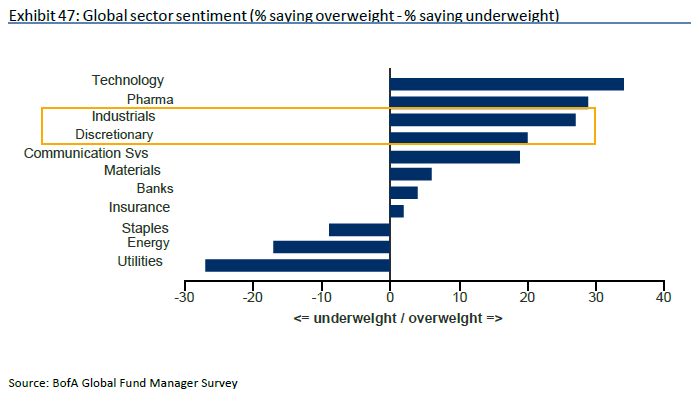
In the monthly BofA fund manager survey, it's interesting to note that industrials and consumer discretionary stocks are among the most overweight through early December.
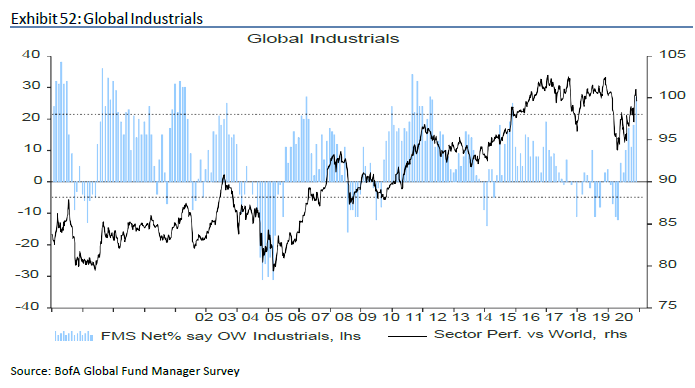
For industrials, this is among the highest overweight positions they've ever articulated.
It's particularly interesting because the Corporate Insider Buy/Sell Ratio for discretionary stocks has just moved into the sell zone. As always with insiders, buys are a better indicator than sells, but still.
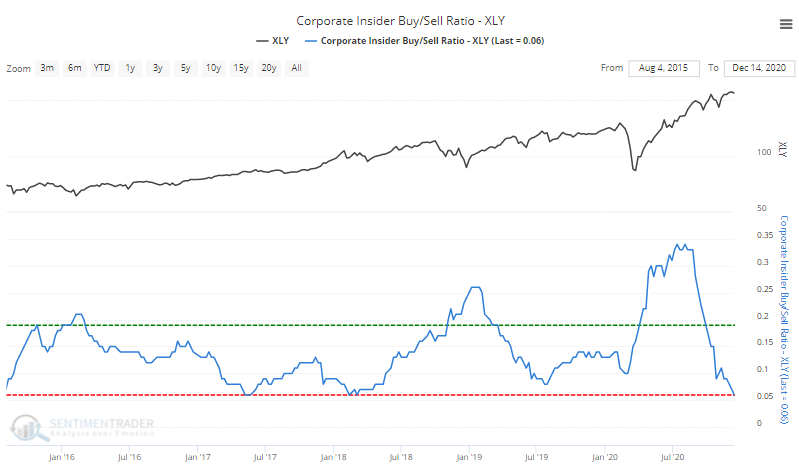
The same thing is happening with the ratio in industrial stocks.
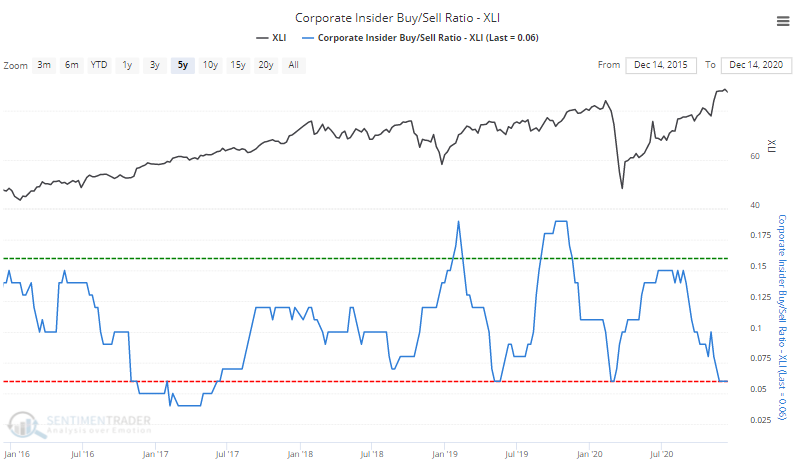
Seems like herd buying at the same time insiders are not isn't a particularly good combo.
Crowded tech
- Published:
2020-12-15 10:42:36 - Author: Jason Goepfert
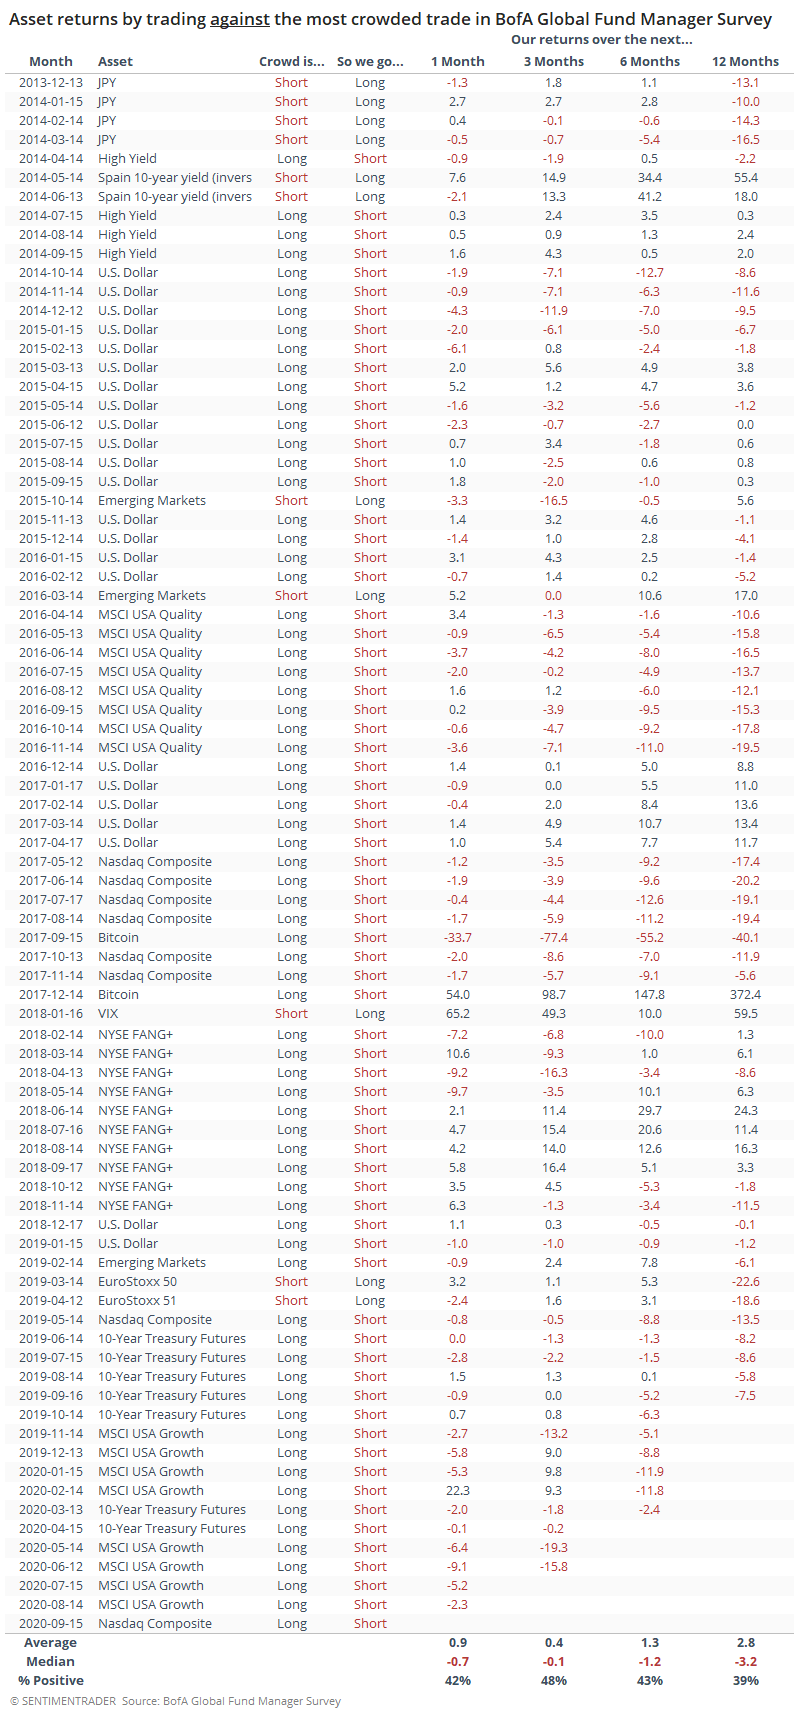
One other point to make about the monthly Bank of America fund manager survey. Once again this month, they consider "tech" to be the most crowded trade.
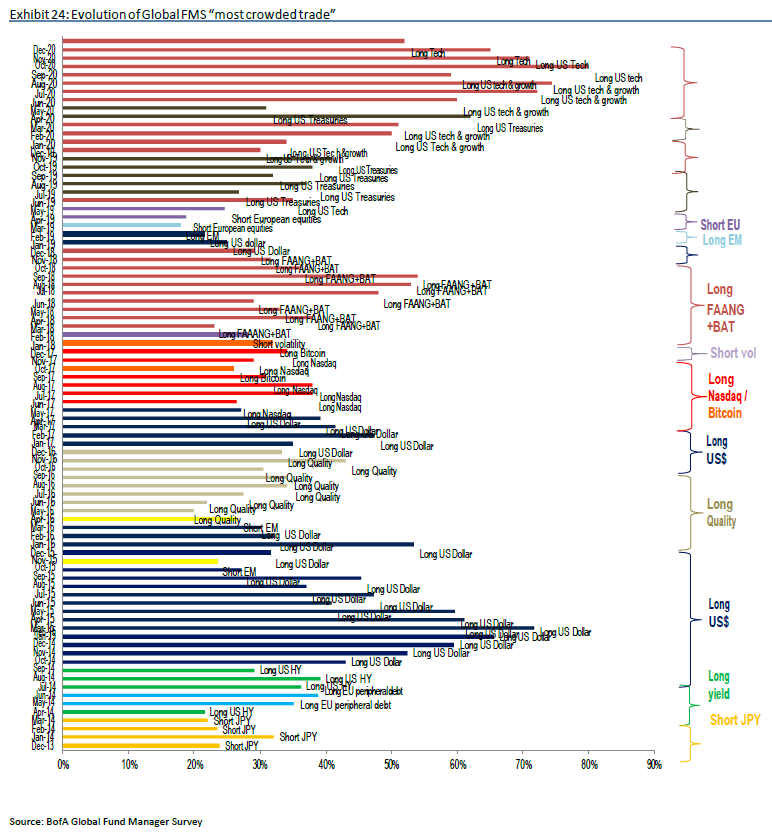
We looked at this extensively in September. To reiterate, the table shows your return (roughly) if you bet AGAINST the most crowded trade. It was mostly unsuccessful. In other words, the most crowded trade had a modest tendency to keep getting more crowded.
MOAR risk
- Published:
2020-12-15 09:02:40 - Author: Jason Goepfert
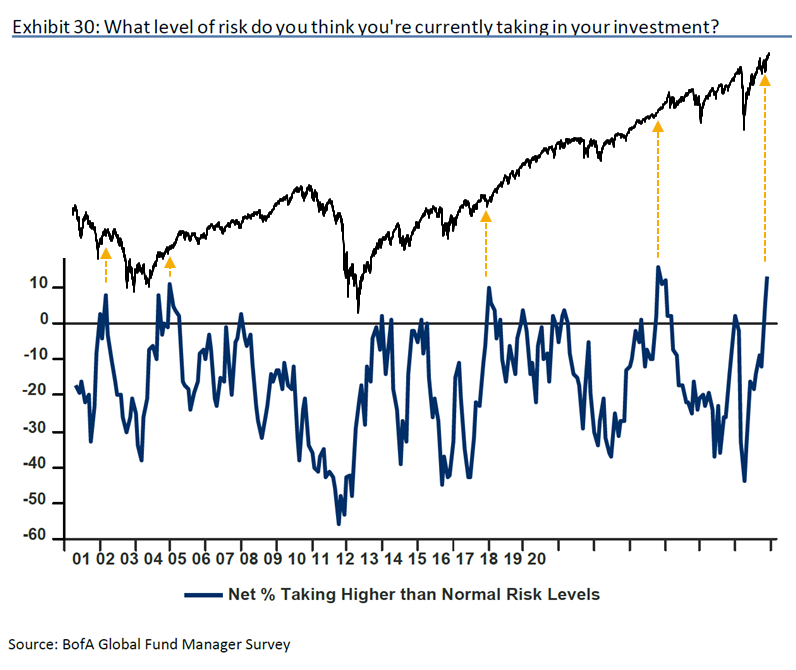
Here's one other part of the monthly Bank of America fund manager survey that stood out - a surge the percentage of managers who think they are taking more risk than normal. It's nearly at a record high.
As we can see below, though, its record as a contrary sell signal is mixed. We superimposed a log chart of the S&P, so this is inexact, but at least it gives us a sense for whether we should consider this as another worrisome extreme in sentiment. Maybe?
Fund managers push their chips in
- Published:
2020-12-15 08:44:28 - Author: Jason Goepfert
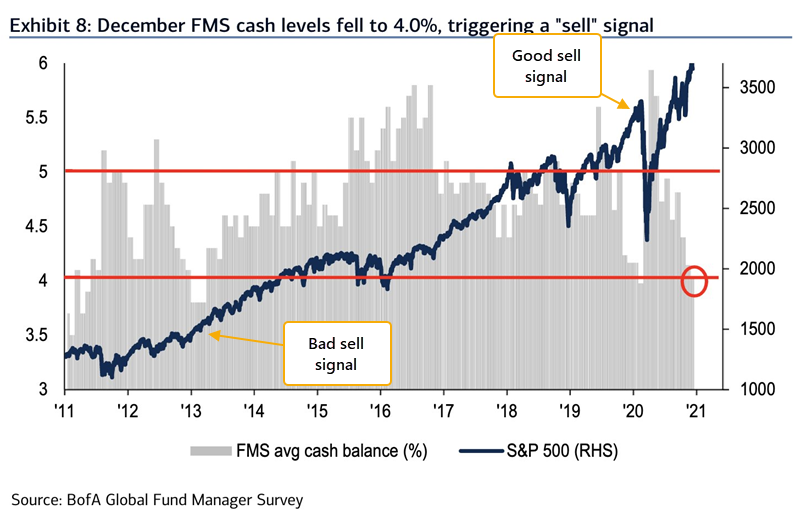
The monthly survey of money managers from Bank of America gets a lot of attention, but in the years we've looked at it, its record as a contrary indicator (or not) is mixed at best. The just-released survey will generate a lot of attention because cash levels among managers plunged, triggering a sell signal.
The last one was timely. The one before that, in 2013, most certainly was not.
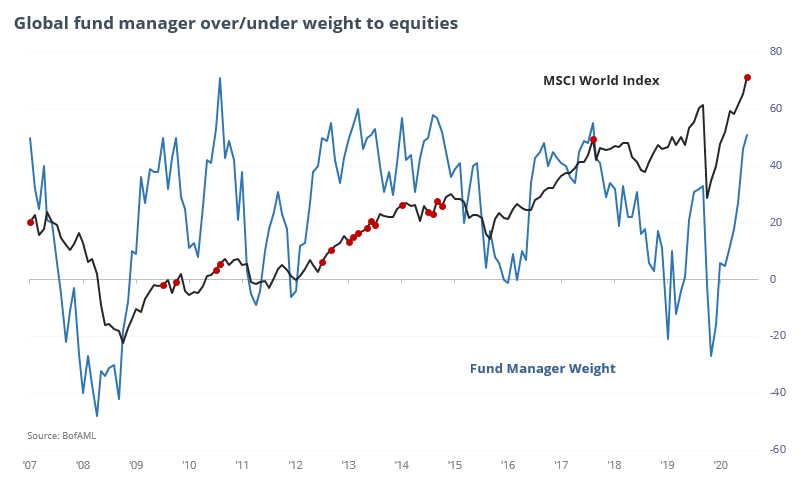
All that cash was put to work in global equities, where managers are now more than 50% overweight. The red dots on the chart show other months with more than 50% overweight. It preceded a couple of tops, but mostly just continued upside.
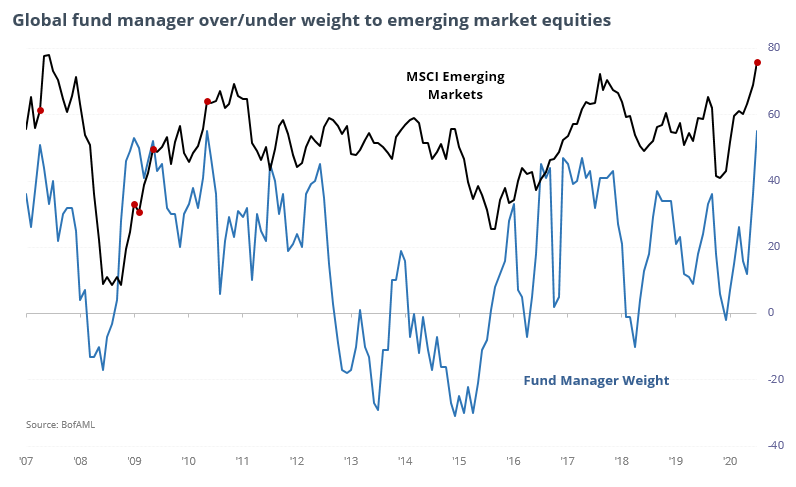
They're the most overweight emerging markets in many years. But again, months when they were more than 50% overweight showed no consistent future pattern.
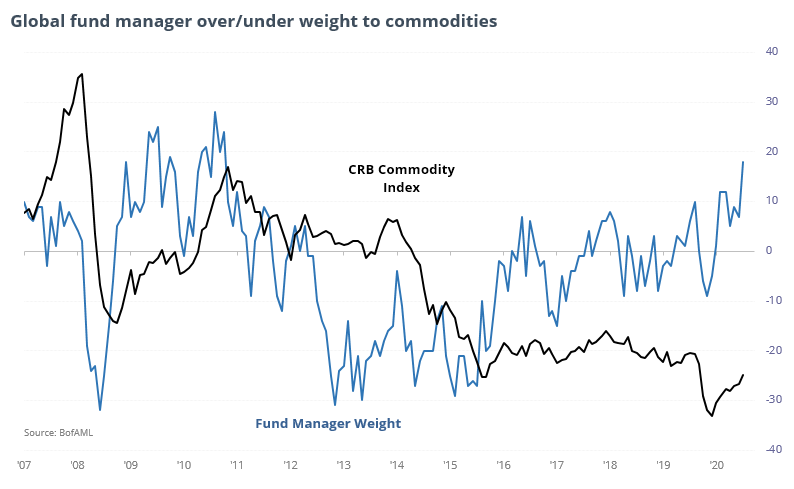
They've become the most positive on commodities in a decade. There is a bit more consistency here as a contrary indicator, so maybe a mild warning for all the new commodity market bulls.