Minutes Digest for Dec 11 2020

Bond doji and social bulls
- Published:
2020-12-11 13:58:48 - Author: Jason Goepfert
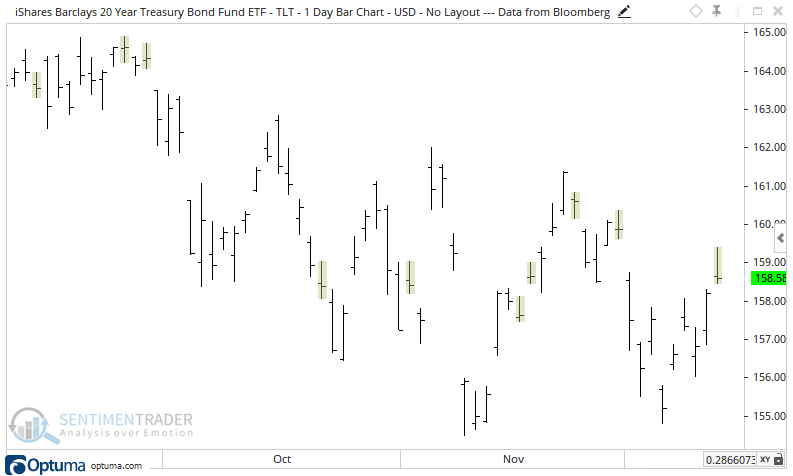
The 20+ year Treasury bond fund, TLT, is reversing some early gains, carving out a doji pattern. It's considered a negative reversal signal of buying exhaustion when coming after a rally, though its record is mixed.
At the same time, Social Sentiment on TLT has dropped below 0.75 over the past week. This functions like a put/call ratio, with a low reading meaning that folks on Twitter have been using more positive than negative words in association with the fund.
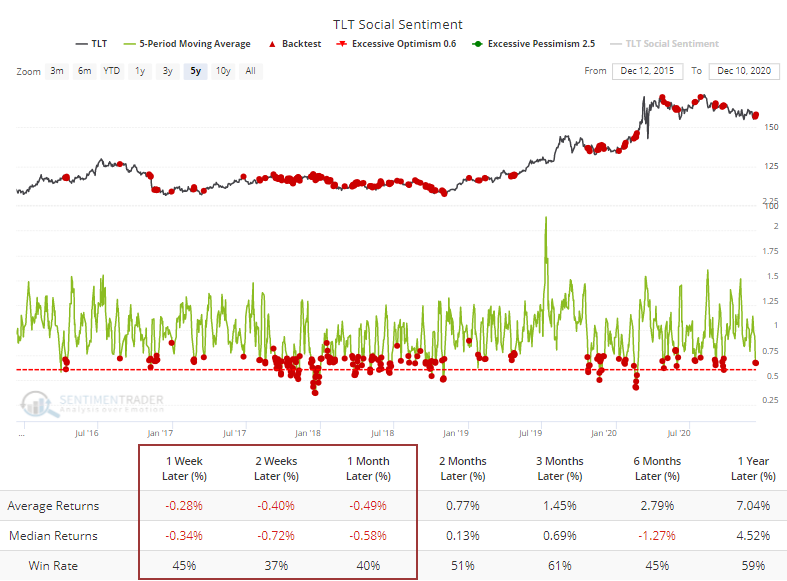
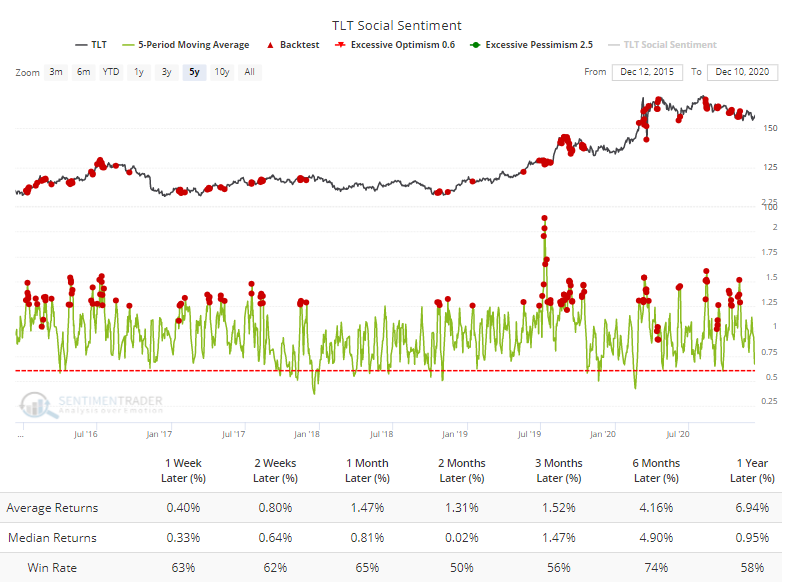
When the 5-day average was this low over the past 5 years, we can see how weak TLT did over the shorter-term. It's quite a bit worse than the opposite extreme when socially-minded investors were tweeting more negative than positive things about the fund.
XLY shooting for 5 straight down days
- Published:
2020-12-11 10:57:08 - Author: Jason Goepfert
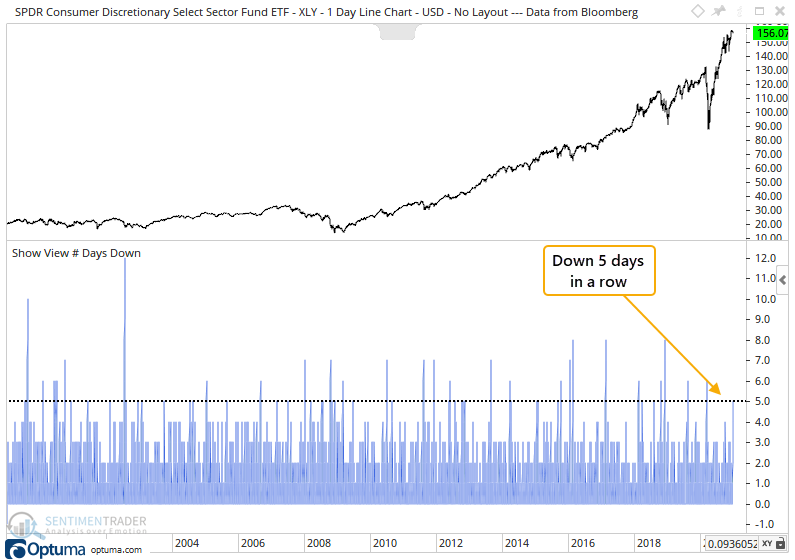
Among major sector and industry ETFs, the XLY consumer discretionary fund has suffered the most consistent selling pressure. Its losses have been limited, but it's working on its 5th straight down day, the longest negative streak among major ETFs.
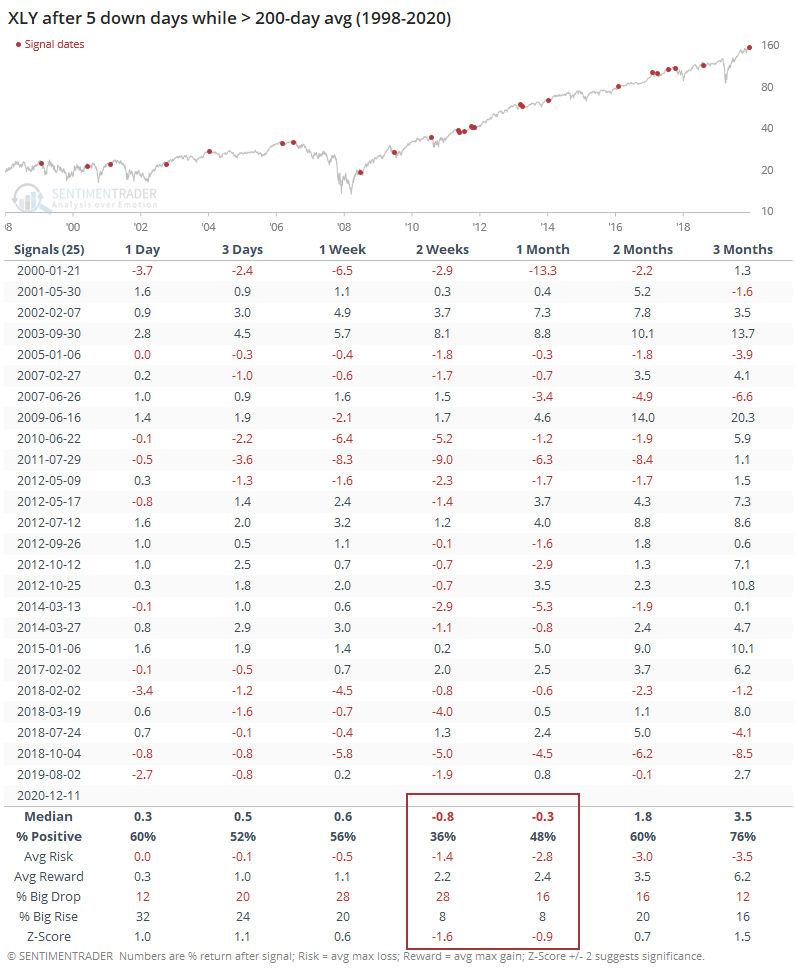
When the fund was trading above its 200-day average at the time, a 5-day losing streak wasn't much of a reason to buy. Over the next 2-4 weeks, it suffered further losses most of the time.
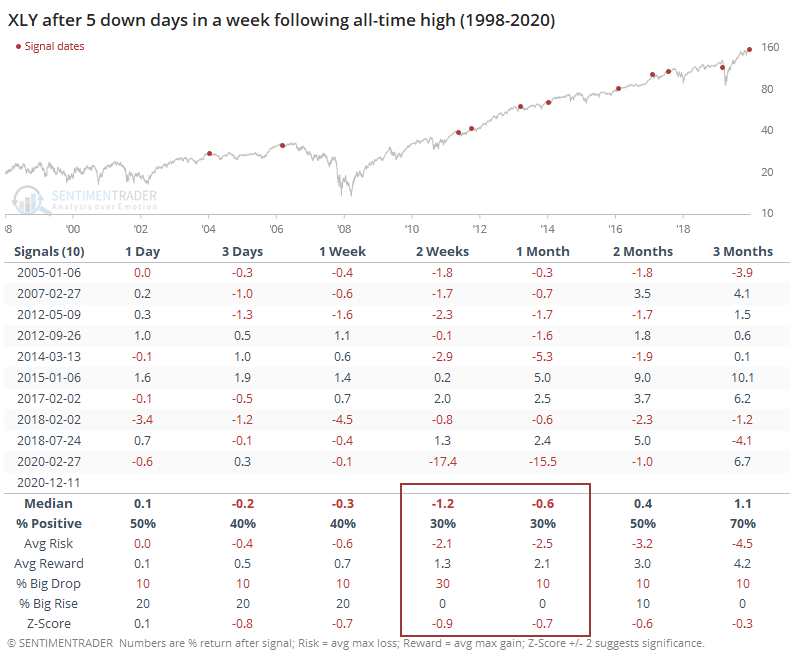
If the streak triggered in a week following an all-time high, returns were even worse.
Utilities not so hot
- Published:
2020-12-11 09:52:06 - Author: Jason Goepfert
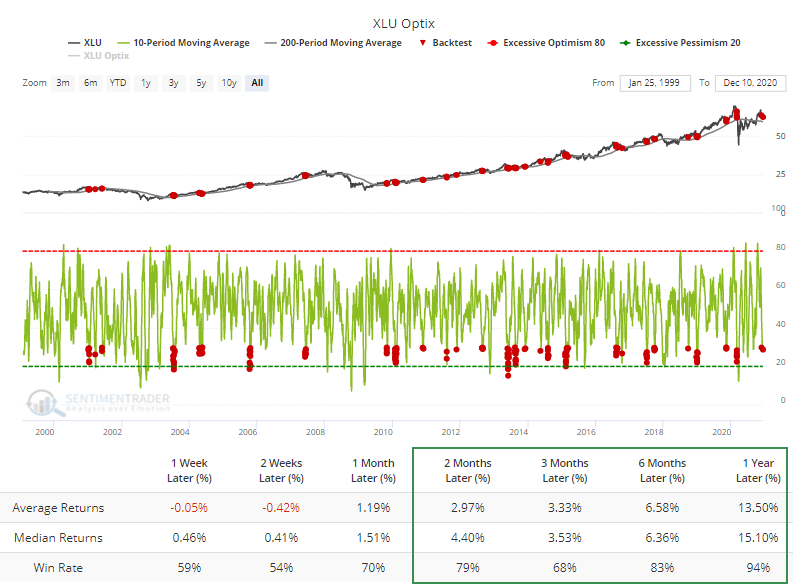
On the Heatmap I showed earlier, the lowest optimism is seen in utilities right now. The 10-day Optimism Index for XLU is below 30, even while the fund is holding above its 200-day moving average. That's been a decent medium- to long-term sign per the Backtest Engine.
Hot energy
- Published:
2020-12-11 09:47:08 - Author: Jason Goepfert
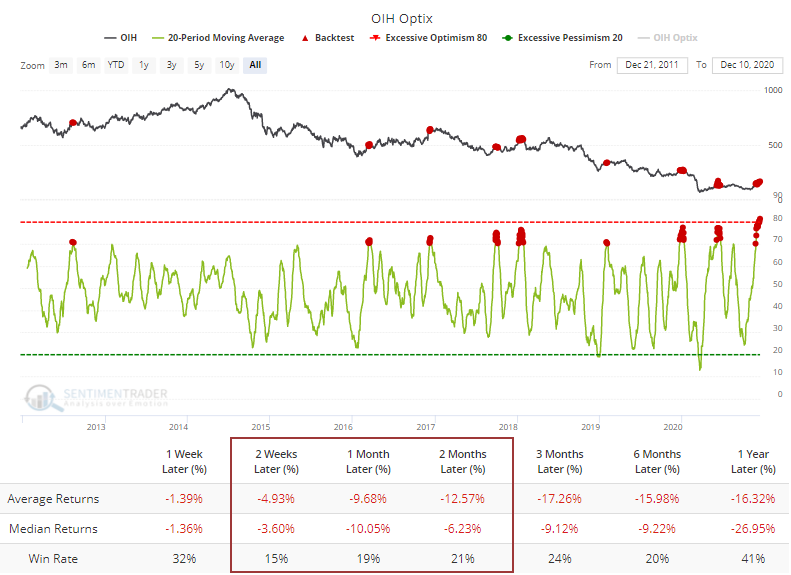
The Heatmap is showing that optimism is in the "bright red" zone for energy ETFs.
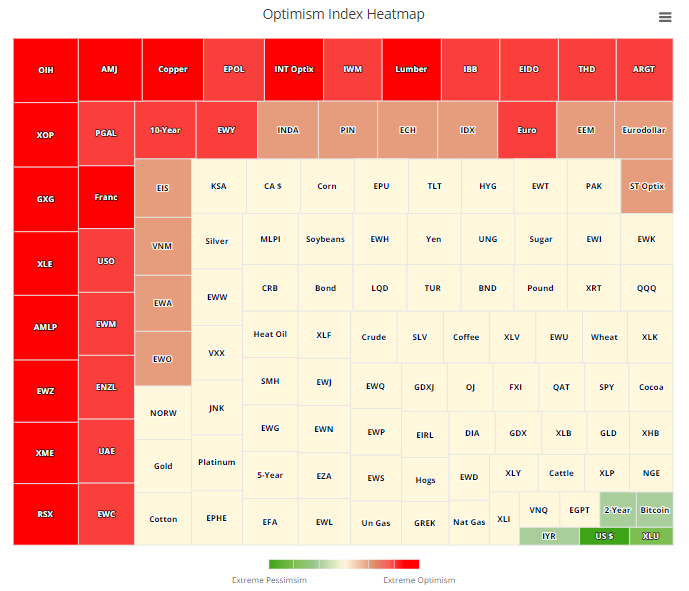
Looking at OIH, in particular, the 20-day average just hit a record high. Any time it's been above 70, the fund has showed almost universal losses over the next 2-4 weeks, so bulls gotta hope the trend has truly changed here.
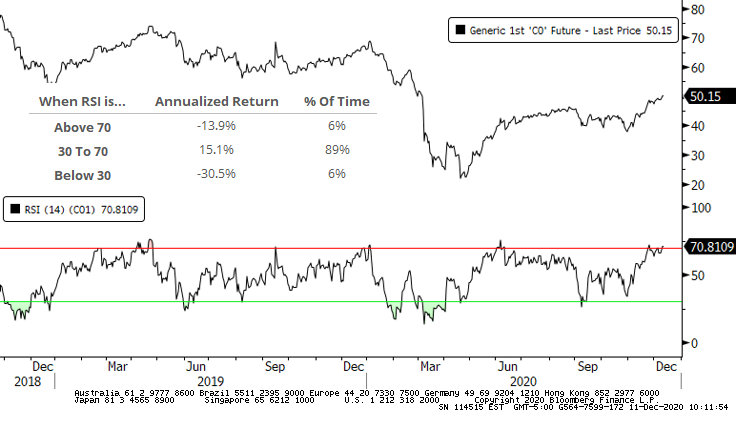
Overbought oil
- Published:
2020-12-11 09:15:38 - Author: Jason Goepfert
Oil's been on a tear lately, and the RSI for the Brent contract is now overbought. Since 1988, the contract has shown a hefty annualized loss when it's this overbought.
Unique to trendy markets like commodities and currencies, it shows an even larger loss when it's oversold. The best returns have occurred when it's not too hot, and not too cold.