Minutes Digest for Dec 03 2020

3 weeks of leverage
- Published:
2020-12-03 13:51:29 - Author: Jason Goepfert
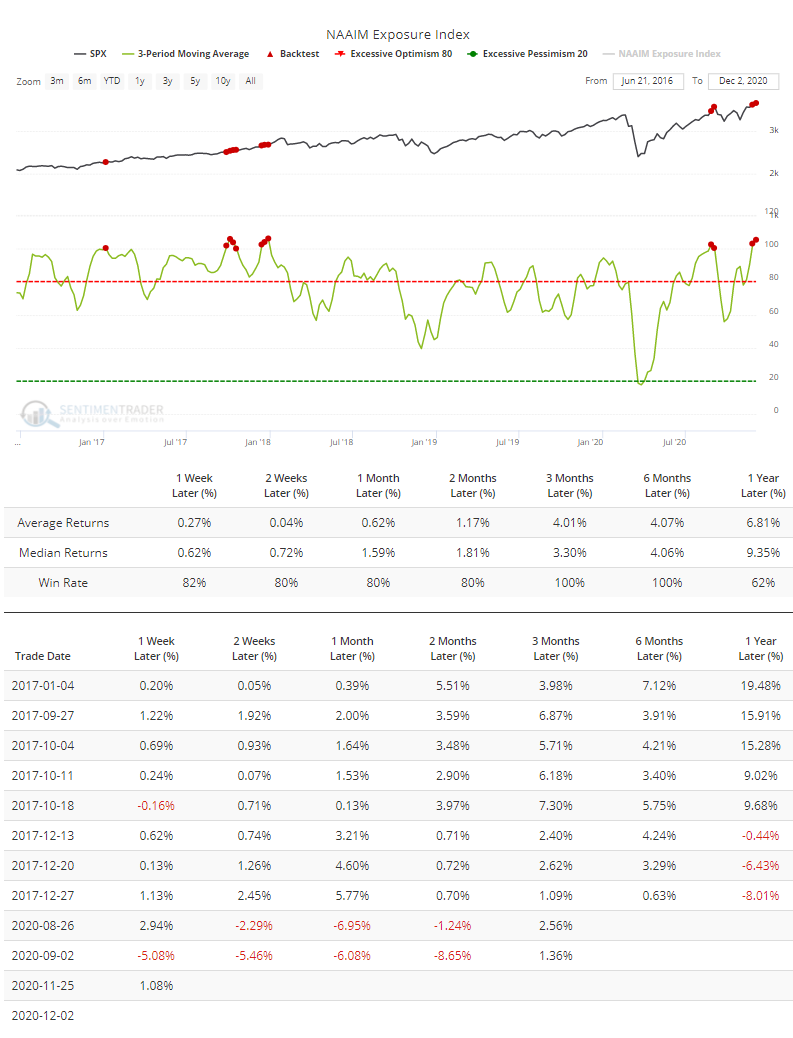
Over the past 3 weeks, active investment managers in the NAAIM survey have carried a leveraged long position. We've gone over this multiple times before, but it's worth repeating - while it might sound scary, this has not been a good contrary indicator. The Backtest Engine shows that all 10 weeks led to higher prices over the next 3 months when the average 3-week exposure of these managers was over 100%.
ETF option skew
- Published:
2020-12-03 13:26:33 - Author: Jason Goepfert
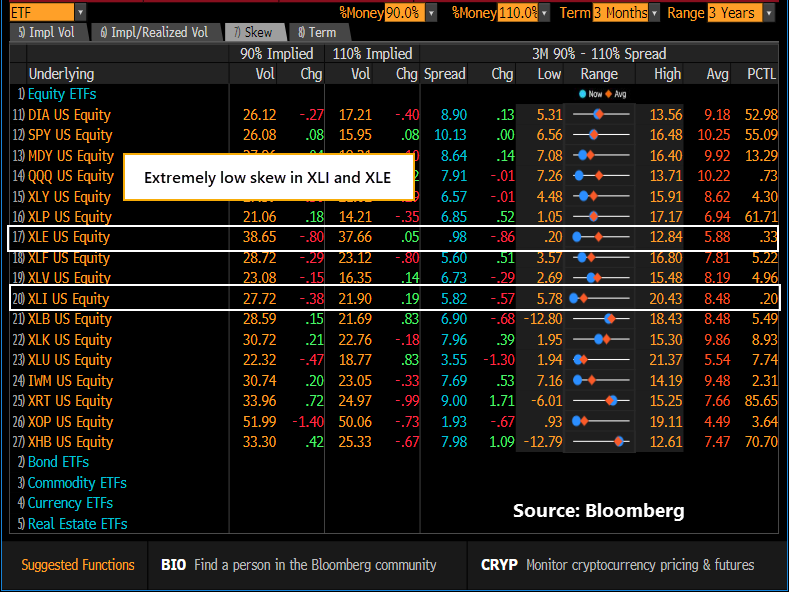
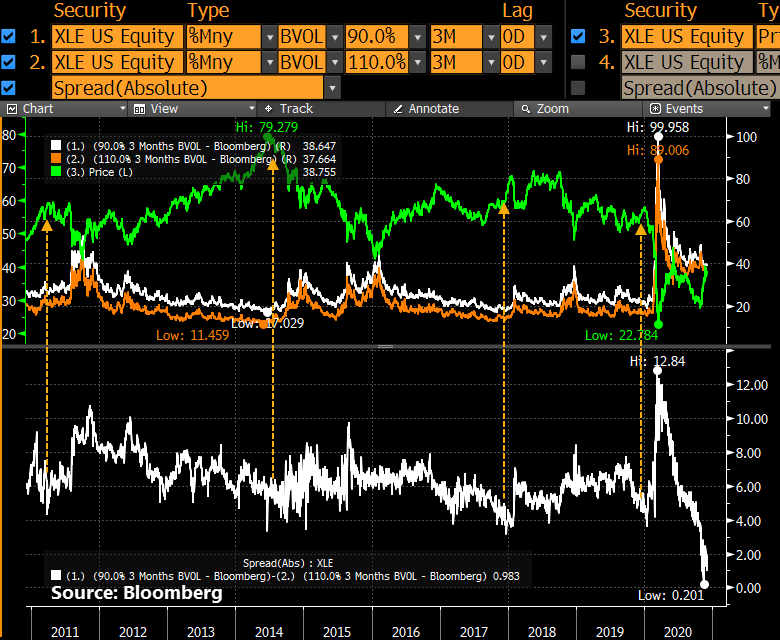
We saw on Monday how options traders have been jumping into calls again. They've been paying up for the privilege, too. Among major ETFs, the two where traders are paying the most for calls relative to puts are XLI and XLE (industrials and energy). The 3-month 10% OTM skew for both is knocking on the lowest levels in the past 3 years.
The charts below are kind of messy, but we can see the skew (in white) versus the prices of the ETFs (in green). The lower the skew, the more traders are focused on paying up for calls versus puts. It hasn't been too much of a contrary indicator for XLI.
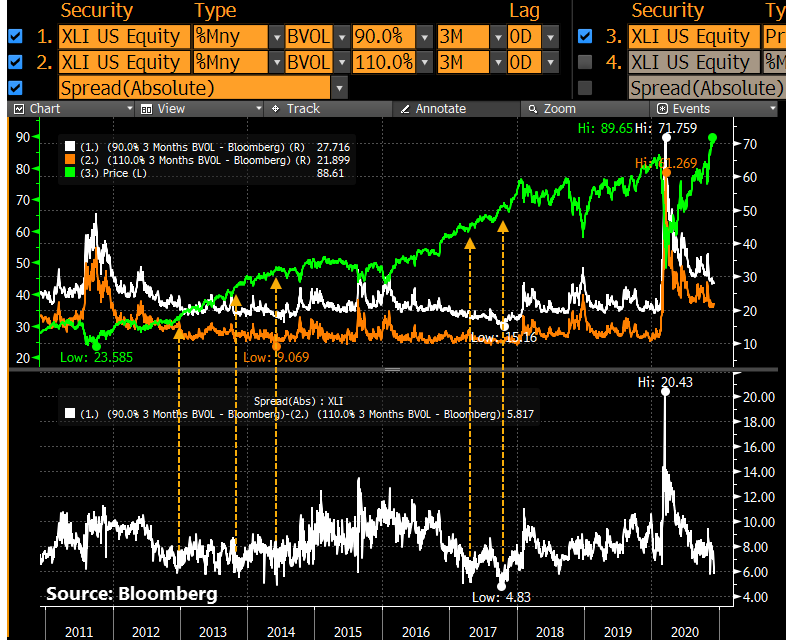
It's been more of a worry for XLE. The fund is at a point that has stopped many previous rallies and it needs to shake that off to have more confidence in the idea that the long-term trend has changed for the better in energy names.
Industrial insiders
- Published:
2020-12-03 09:09:11 - Author: Jason Goepfert
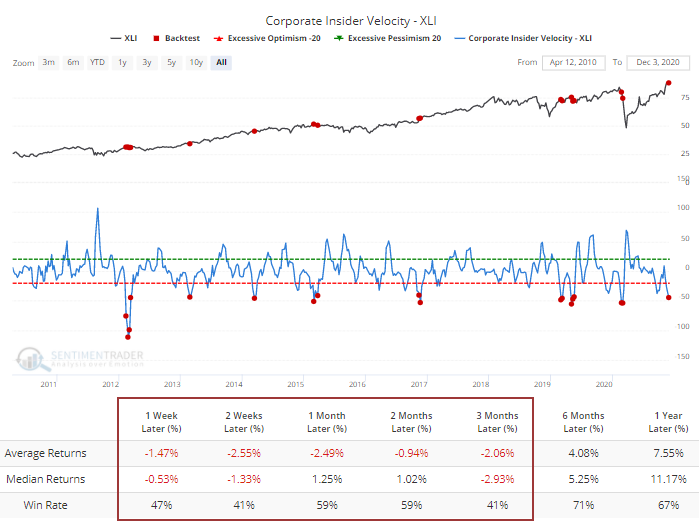
Among sectors, one of them with the worst rates of change in insider buying versus selling activity is industrials. When it's been this low, XLI has had a bit of trouble holding gains so we'll see if it can hold above the recent gap up opens.
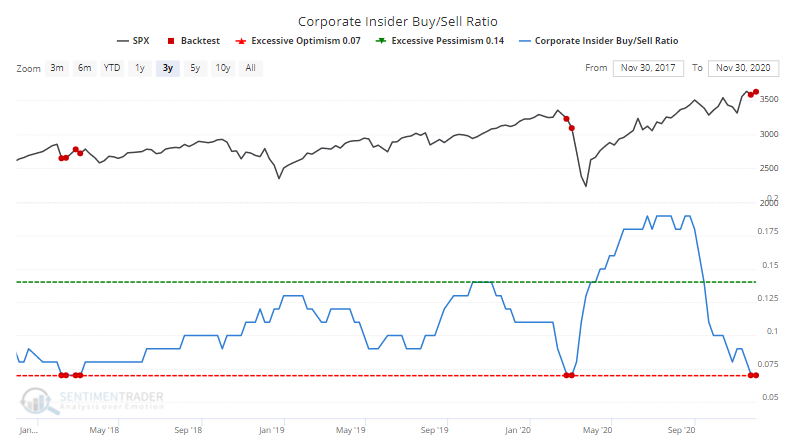
Insider buy/sell ratio drops
- Published:
2020-12-03 07:13:17 - Author: Jason Goepfert
Bit of a worry here as corporate insider buying dries up among S&P 500 stocks (partly due to the window during earnings announcements). The Buy/Sell Ratio is still at an extreme low, which has preceded some trouble in recent years. Note that prior to 2017, it was not especially effective.