Data &
Technology
Research
Reports
Report Solutions
Reports Library
Actionable
Strategies
Free
Resources
Simple Backtest Calculator
Simple Seasonality Calculator
The Kelly Criterion Calculator
Sentiment Geo Map
Public Research Reports
Free Webinar
Pricing
Company
About
Meet Our Team
In the News
Testimonials
Client Success Stories
Contact
Log inLoginSign up
< BACK TO ALL REPORTS

Minutes Digest for Jan 05 2021

Jason Goepfert
2021-01-05
SentimenTrader Minutes Digest for Jan 05 2021 covering: Russell reversal; Energy has energy; Gold rush

Russell reversal

  • Published:
    2021-01-05 13:30:30
  • Author: Jason Goepfert

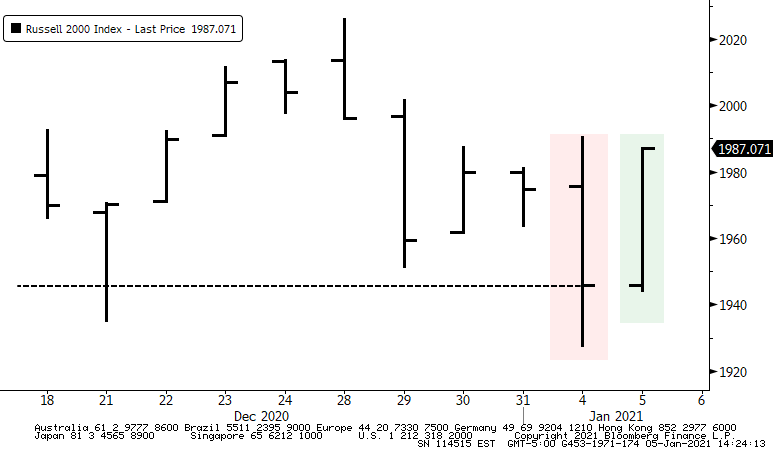
After a tough day yesterday, small-caps are among the leaders on Tuesday. The Russell 2000 is on track to completely reverse Monday's losses, which pushed the index to nearly a 1.5% loss and to a 10-day low.

There have been surprisingly few instances of the index reversing such a big loss the next day, and so close to a 52-week high. Only one of them ended up leading to sustained, if minor, gains.

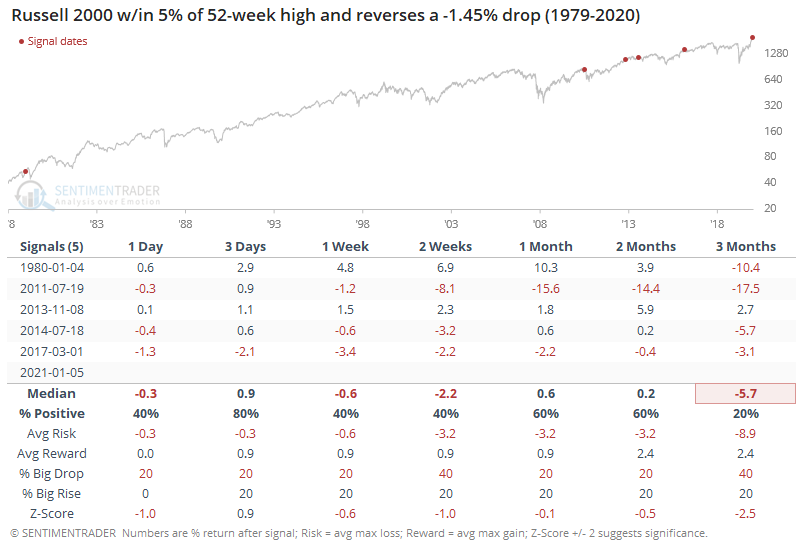
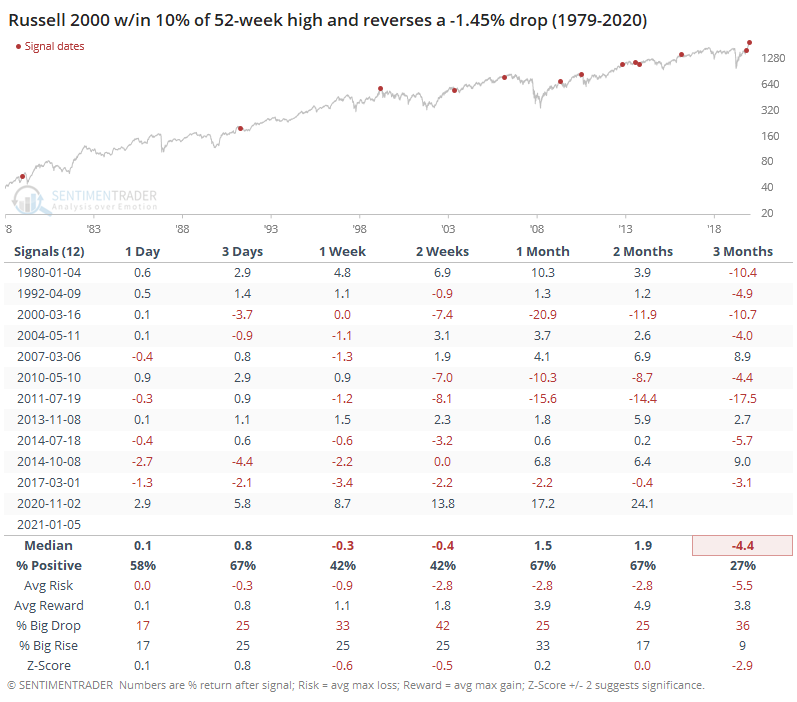
If we look at signals within 10% of a high, then we more than double the still-small sample size. Returns were still curiously weak, though, especially over the next 3 months, with only 3 winners out of the 12 precedents but the latest one from November will surely show a gain as well. As we see so often, what looks obvious on a chart doesn't necessarily hold up under scrutiny.
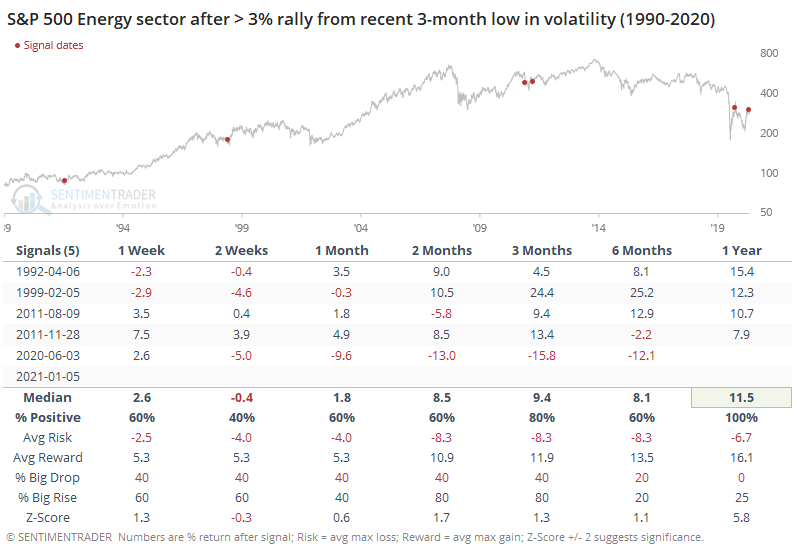

Energy has energy

  • Published:
    2021-01-05 12:01:25
  • Author: Jason Goepfert

Energy stocks went into hibernation over the past two weeks, pushing its 10-day historical volatility down to multi-month lows. Today, many of the indexes and individual stocks are breaking above their highs from that consolidation period.

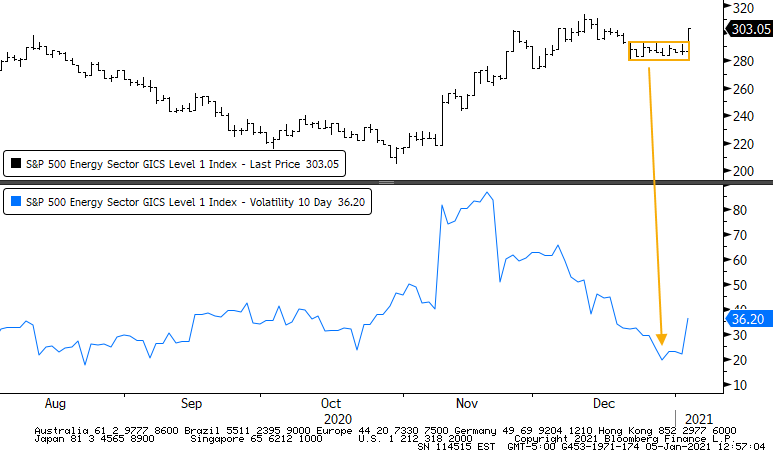
The sector has had a tough go of it for long stretches, so we've seen a few periods of false hope for the group. The last time we saw a break from short-term consolidation, last June, the stocks ran for another week or so, then had a very rough few months. The others mostly led to gains, but with the caveat of a tiny sample size.
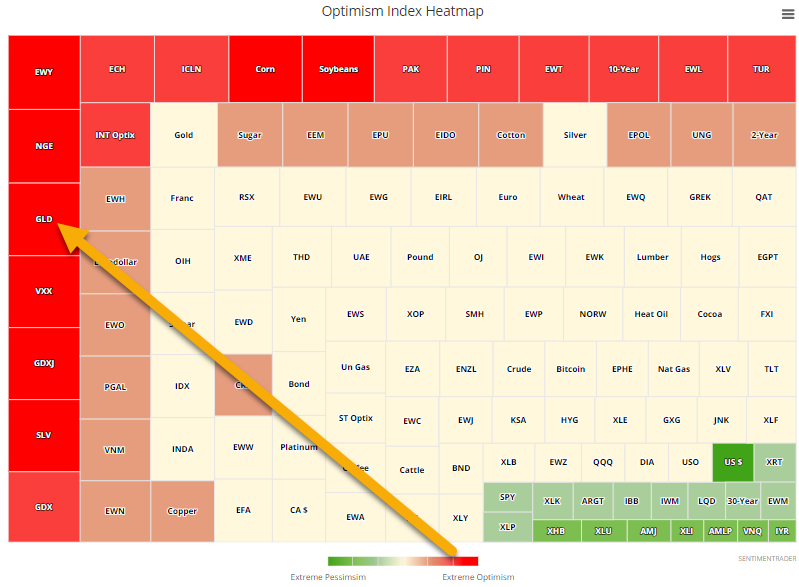

Gold rush

  • Published:
    2021-01-05 07:46:43
  • Author: Jason Goepfert

The Heatmap shows that the jump in gold on Monday was enough to push the Optimism Index for GLD toward the upper-left quadrant, reserved for the markets showing the most extreme optimism.

According to the Backtest Engine, it's been tough for GLD to consistently add to its gains after recording such a high reading, with negative average returns across most time frames up to 3 months later.

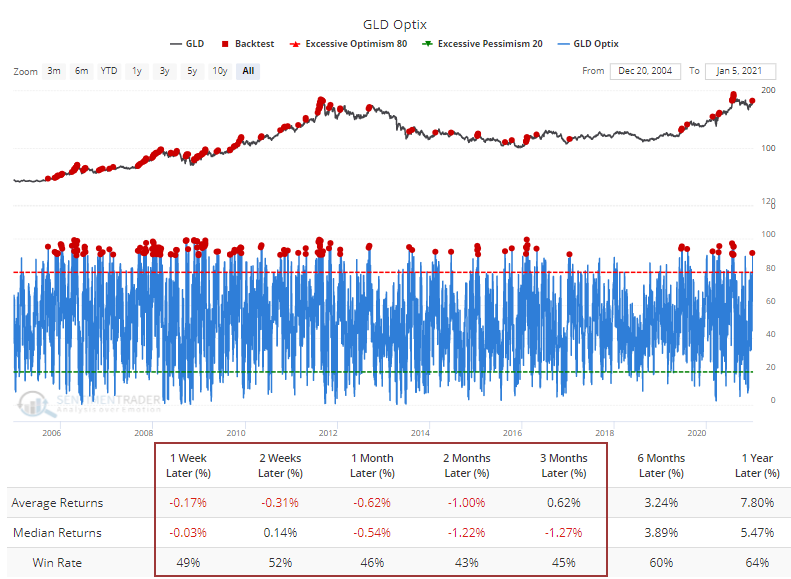
There was a +0.30 correlation between the 1-week and 3-month returns, giving a modest suggestion that if buyers continue to be interested in gold even after a surge like this, then it bodes well for medium-term returns.


Sorry, you don't have access to this report

Upgrade your subscription plan to get access
Go to Dasboard
DATA &
TECHnologies
IndicatorEdge
‍
BackTestEdge
‍
Other Tools
‍
DataEdge API
RESEARCH
reports
Research Solution
‍
Reports Library
‍
actionable
Strategies
Trading Strategies
‍
Smart Stock Scanner
‍
FREE
RESOUrCES
Simple Backtest
Calculator
Simple Seasonality
Calculator
The Kelly Criterion
Calculator
Sentiment Geo Map
‍
Public Research Reports
‍
Free Webinar
COMPANY
‍
About
‍
Meet our Team
‍
In the News
‍
Testimonials
‍
Client Success Stories
Pricing
Bundle pricing
‍
Announcements
‍
FAQ
© 2024 Sundial Capital Research Inc. All rights reserved.
Setsail Marketing
TermsPrivacyAffiliate Program
Risk Disclosure: Futures and forex trading contains substantial risk and is not for every investor. An investor could potentially lose all or more than the initial investment. Risk capital is money that can be lost without jeopardizing ones’ financial security or life style. Only risk capital should be used for trading and only those with sufficient risk capital should consider trading. Past performance is not necessarily indicative of future results.

Hypothetical Performance Disclosure: Hypothetical performance results have many inherent limitations, some of which are described below. No representation is being made that any account will or is likely to achieve profits or losses similar to those shown; in fact, there are frequently sharp differences between hypothetical performance results and the actual results subsequently achieved by any particular trading program. One of the limitations of hypothetical performance results is that they are generally prepared with the benefit of hindsight. In addition, hypothetical trading does not involve financial risk, and no hypothetical trading record can completely account for the impact of financial risk of actual trading. for example, the ability to withstand losses or to adhere to a particular trading program in spite of trading losses are material points which can also adversely affect actual trading results. There are numerous other factors related to the markets in general or to the implementation of any specific trading program which cannot be fully accounted for in the preparation of hypothetical performance results and all which can adversely affect trading results.

Testimonial Disclosure: Testimonials appearing on this website may not be representative of other clients or customers and is not a guarantee of future performance or success.