
Midcaps: April through July of Post-Election Years

Froth and excess are found just about everywhere in the financial markets of late. Likewise, in recent days the stock market has begun to show some signs of weakness, which is raising the anxiety level among investors. The threat of a larger decline is one that needs to be taken very seriously.
Is this the top? It beats me. But if you are looking for some reason to "stay the course" then the following morsel might help.
Midcap Stocks in Post-Election Years
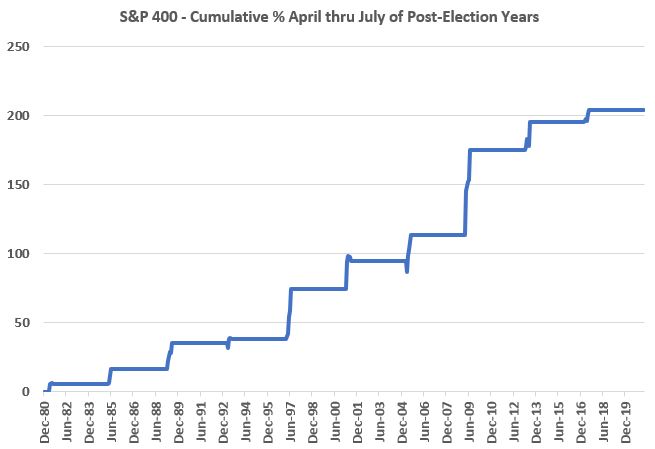
The chart below displays the hypothetical cumulative total return achieved by holding the S&P Midcap 400 Index:
- ONLY during the months of April through July
- ONLY during post presidential election years (since 1981 when the S&P 400 was 1st calculated)
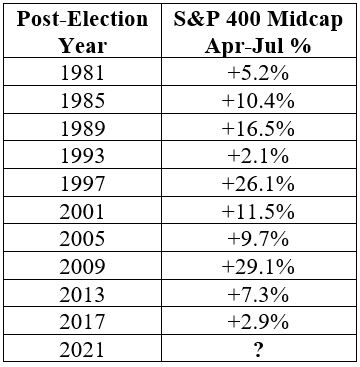
The table below shows the percentage total return for each of the post-election April through July periods displayed in the chart above.
Things to note:
- The average % return was +12.1%
- The median % return was +10.1%
- The smallest % return was +2.1% (in 1993)
Does any of this mean that stocks are sure to hold up at least through the end of July? Not at all. There is no reason that 2021 cannot be the first year listed in the table above to finish with a minus sign for April through July.
But this type of information can help to at least give an investor some pause when they feel that panicked/worried feeling coming on.