Data &
Technology
Research
Reports
Report Solutions
Reports Library
Actionable
Strategies
Free
Resources
Simple Backtest Calculator
Simple Seasonality Calculator
The Kelly Criterion Calculator
Sentiment Geo Map
Public Research Reports
Free Webinar
Pricing
Company
About
Meet Our Team
In the News
Testimonials
Client Success Stories
Contact
Log inLoginSign up
< BACK TO ALL REPORTS

Mid Year Trade Signal Review

Dean Christians
2021-07-01
Let's review year-to-date trade signals based on proprietary timing models for Indexes and ETFs.

My colleague Jay wrote an excellent article titled, What it Takes to Succeed in the Markets. And while one could write an entire book on the subject matter, I will focus on what I think would be a good chapter in today's note. Whether you're a seasoned veteran or a novice, one should always strive to become better at what is a very challenging endeavor, the skill of investing. We can seek to accomplish this goal by reviewing our trades or investments to learn whether our process or plan is working. If we find that things aren't going so well, we may want to make some refinements.

Now that the first half of 2021 is in the books, let's review trading signals that I've shared with subscribers to assess the validity of the approach and see if we need to make any refinements.

The following trade signals/statistics reflect a hypothetical execution on the next day open after an entry or exit occurs on the previous day's close. Please remember these are trade signals based on a model and not a forecast from a study.

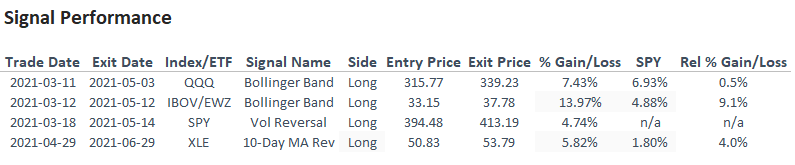
YTD CLOSED TRADE SIGNALS

Since March, a total of 4 hypothetical trades have been closed based on the optimal days-in-trade holding period. So far, the signals are performing well as each one shows a positive absolute and relative gain. The Bollinger Band signal, a mean reversion model, is triggering more often than other methods. I like the model as it provides an excellent opportunity to buy oversold conditions in groups that may be out of favor temporarily. However, it will work until it doesn't work. i.e., it could struggle in a bear market environment.

We currently have hypothetical open trades in QQQ, EWZ, and EWT.

MODEL REFINEMENT 

After monitoring and reviewing signals for the Bollinger Band mean reversion model, I will make a minor adjustment to the signal criteria. When an index consolidates, the Bollinger Bands for individual stocks will contract as volatility drops. The contraction in volatility makes it easier for stocks to close outside the bands on a short but sharp move. When this occurs, the percentage of members trading below their lower BB will spike and create a signal that I'm not interested in taking. Let's look at the following chart as it will provide an excellent example of the need to make a slight adjustment.

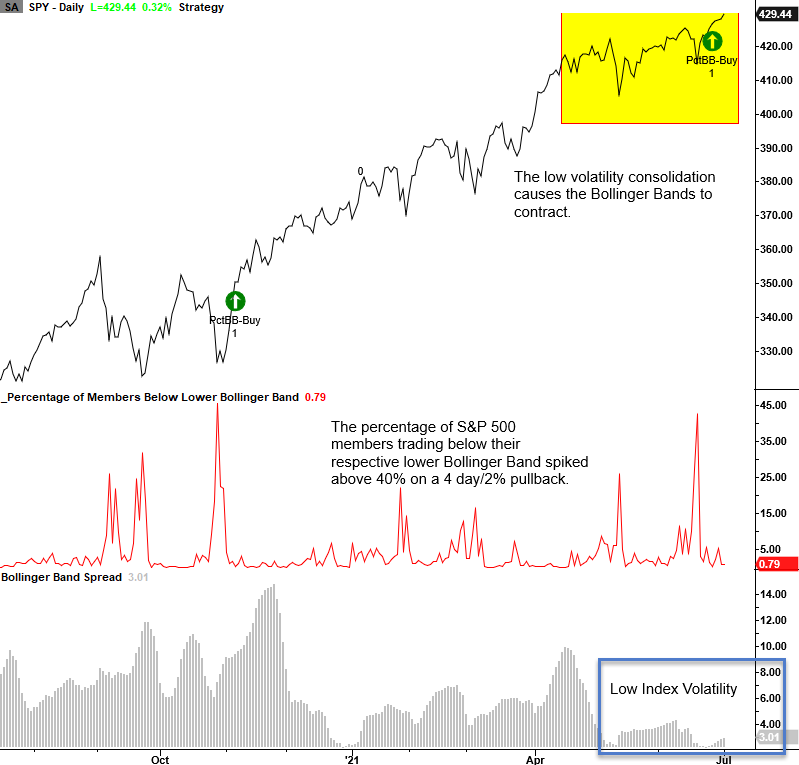
The Bollinger Band Spread in the last sub-graph measures the difference between the upper and lower band. I use it to measure volatility in other models. The plan is to incorporate it in the BB mean-reversion model. The spread for the index or ETF will need to be above a user-defined level for a signal to be generated. The adjustment will help to identify a higher volatility oversold condition that provides a better mean reversion opportunity.

Trade review and refinement should be an essential part of one's trading or investment process. The competition is always getting better, are you?

Sorry, you don't have access to this report

Upgrade your subscription plan to get access
Go to Dasboard
DATA &
TECHnologies
IndicatorEdge
‍
BackTestEdge
‍
Other Tools
‍
DataEdge API
RESEARCH
reports
Research Solution
‍
Reports Library
‍
actionable
Strategies
Trading Strategies
‍
Smart Stock Scanner
‍
FREE
RESOUrCES
Simple Backtest
Calculator
Simple Seasonality
Calculator
The Kelly Criterion
Calculator
Sentiment Geo Map
‍
Public Research Reports
‍
Free Webinar
COMPANY
‍
About
‍
Meet our Team
‍
In the News
‍
Testimonials
‍
Client Success Stories
Pricing
Bundle pricing
‍
Announcements
‍
FAQ
© 2024 Sundial Capital Research Inc. All rights reserved.
Setsail Marketing
TermsPrivacyAffiliate Program
Risk Disclosure: Futures and forex trading contains substantial risk and is not for every investor. An investor could potentially lose all or more than the initial investment. Risk capital is money that can be lost without jeopardizing ones’ financial security or life style. Only risk capital should be used for trading and only those with sufficient risk capital should consider trading. Past performance is not necessarily indicative of future results.

Hypothetical Performance Disclosure: Hypothetical performance results have many inherent limitations, some of which are described below. No representation is being made that any account will or is likely to achieve profits or losses similar to those shown; in fact, there are frequently sharp differences between hypothetical performance results and the actual results subsequently achieved by any particular trading program. One of the limitations of hypothetical performance results is that they are generally prepared with the benefit of hindsight. In addition, hypothetical trading does not involve financial risk, and no hypothetical trading record can completely account for the impact of financial risk of actual trading. for example, the ability to withstand losses or to adhere to a particular trading program in spite of trading losses are material points which can also adversely affect actual trading results. There are numerous other factors related to the markets in general or to the implementation of any specific trading program which cannot be fully accounted for in the preparation of hypothetical performance results and all which can adversely affect trading results.

Testimonial Disclosure: Testimonials appearing on this website may not be representative of other clients or customers and is not a guarantee of future performance or success.