
Mexican stocks triggered a breadth thrust

Key points:
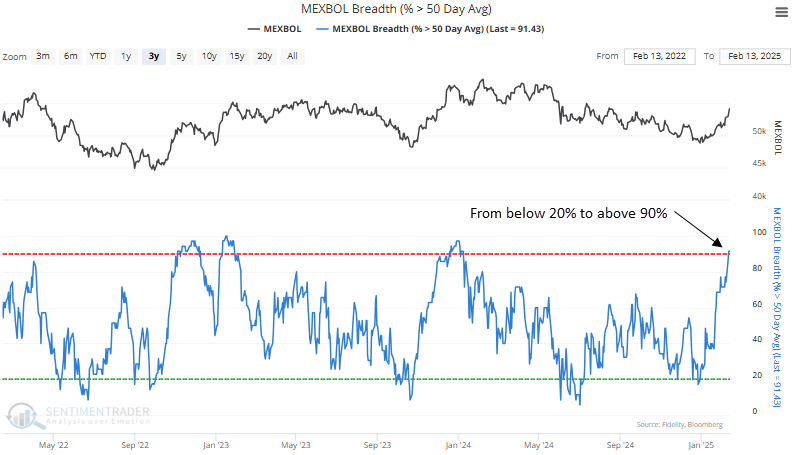
- The percentage of MEXBOL Index stocks above their 50-day average cycled from below 20% to above 90%
- Similar thrusts produced an 80%-win rate for the benchmark Mexico index over the following three months
It's useful to observe when a market behaves contrary to expectations
The percentage of MEXBOL Index stocks above their 50-day moving average increased above 90%, reaching the highest level in over a year.
This recovery in medium-term trends for bellwether Mexican stocks is particularly noteworthy, given the backdrop of trade tariffs, which are generally viewed as a negative by market participants.
Typically, when markets or indicators surge despite unfavorable news, it indicates that investors are looking beyond the immediate risks and positioning for potential upside.
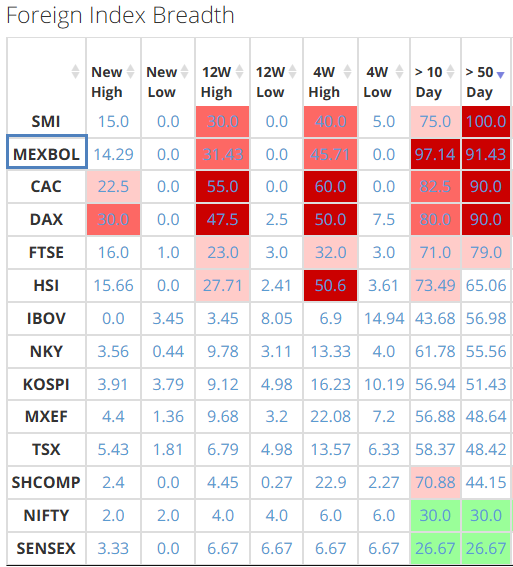
Subscribers can track global breadth indicators directly on the spotlights page under the "Market Breadth" section. As shown in the table below, sorted by percentage above the 50-day average, the MEXBOL Index holds the second-highest number of stocks exceeding their medium-term average.
Similar recoveries in participation preceded a bullish medium-term outlook
With the multi-condition function in the Backtest Engine, subscribers can seamlessly generate and track breadth-based signals. For instance, in today's report, I analyzed when the percentage of MEXBOL Index stocks above their 50-day average cycled from below 20% to above 90%.
The findings include a chart with green arrows marking the signal dates, offering a clear visual representation of historical events. Click here for a copy of the study.
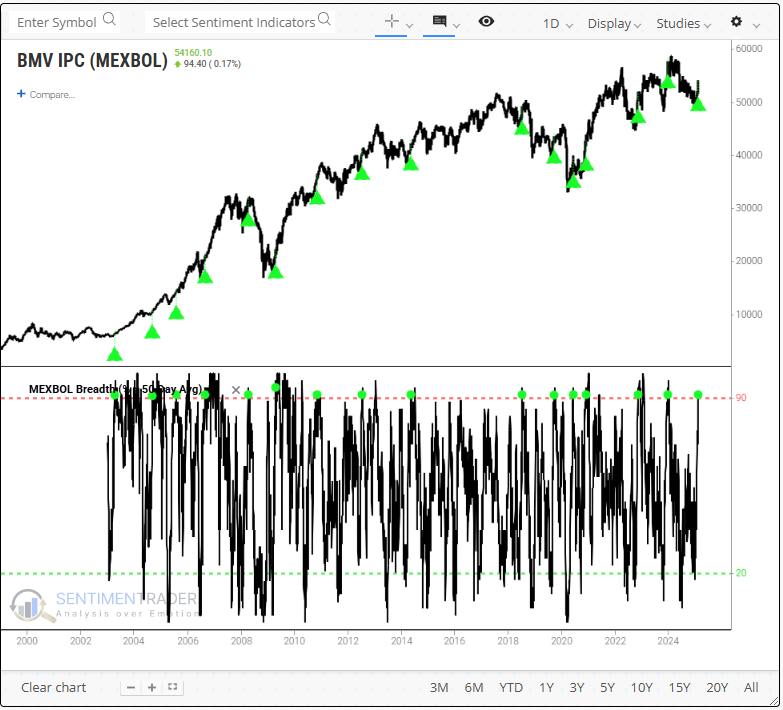
Running an optimization to identify the ideal holding period for the MEXBOL Index, the test returned 59 days. In this case, 13 of the 16 instances were profitable, resulting in a win rate of 81%.
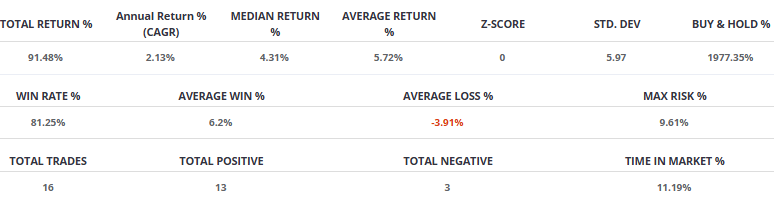
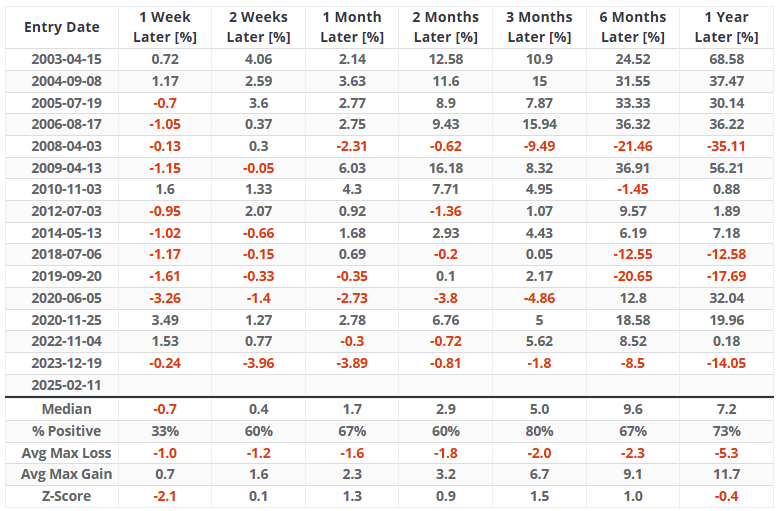
An analysis of prior occurrences over multiple time horizons reveals that the MEXBOL index is likely to pull back in the first week, which is a typical response after thrust signals. However, in the subsequent three months, the index has experienced a rally 80% of the time.
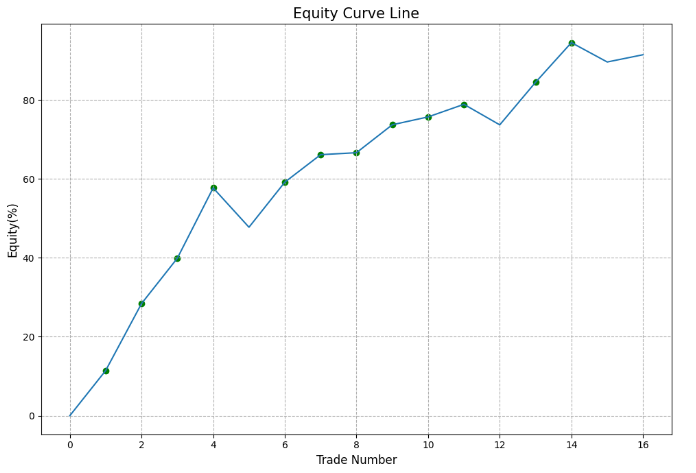
As a rule of thumb, equity curves should ascend gradually from the lower-left quadrant to the upper-right quadrant of the chart, a scenario largely accomplished by the MEXBOL Index thrust signal.
What the research tells us...
Stocks for the benchmark index in Mexico surged, triggering a breadth thrust signal when the proportion of members above their 50-day moving average jumped above 90%. This type of thrust has historically been a strong indicator of continued momentum, as the index has risen 80% of the time over the following three months. When markets act counter to conventional wisdom, they often provide a market tell that something significant is underway. The rally in Mexican equities mirrors similar bullish trends seen in other markets, such as the impressive rally in the German DAX, reinforcing the notion that a broader resurgence is taking shape across the globe.