Metals and bonds give different picture as excess liquidity spikes

There are a lot of tables in this piece, so to summarize what may be an eye-watering amount of small numbers:
There is a historic divergence between copper and interest rates, driven in part by excess liquidity and suppressed rates. Prior divergences preceded some rocky times in stocks, and peaks in liquidity led to long-term declines in stock valuations. Both developments tended to lead to a drop in bond prices, and rise in yields. Other assets showed mixed returns.
The table below gives a quick overview of the longer-term returns in each asset.
| Asset | Copper / 10-Year Yield Divergence | Peak in Excess Liquidity |
| Stocks | Down | Flat |
| Yields | Up | Up |
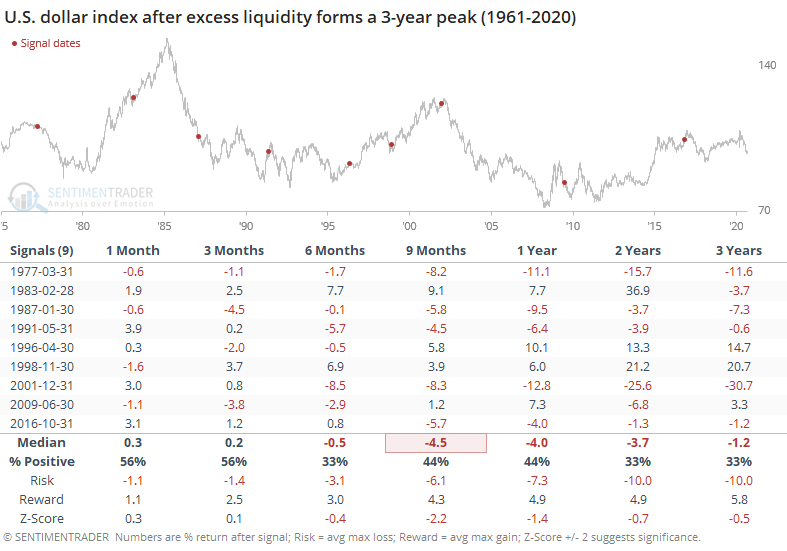
| Dollar | Up | Down |
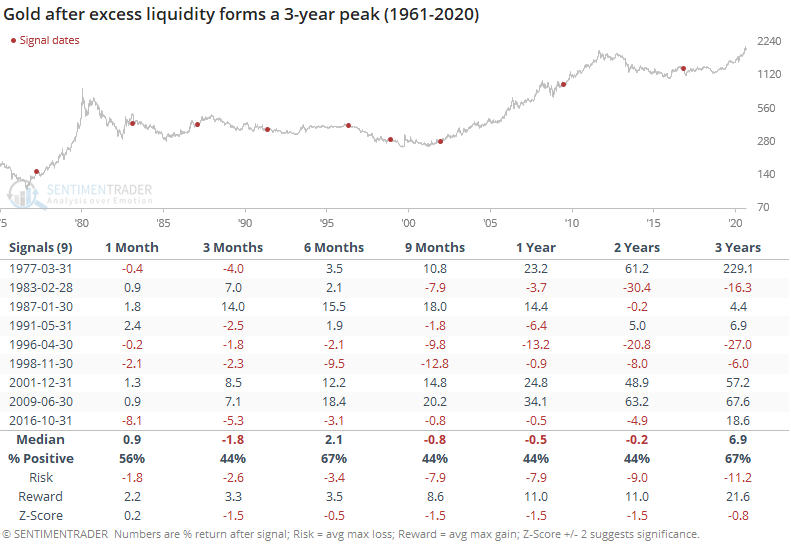
| Gold | Flat | Down |
Copper vs. 10-Year Yields
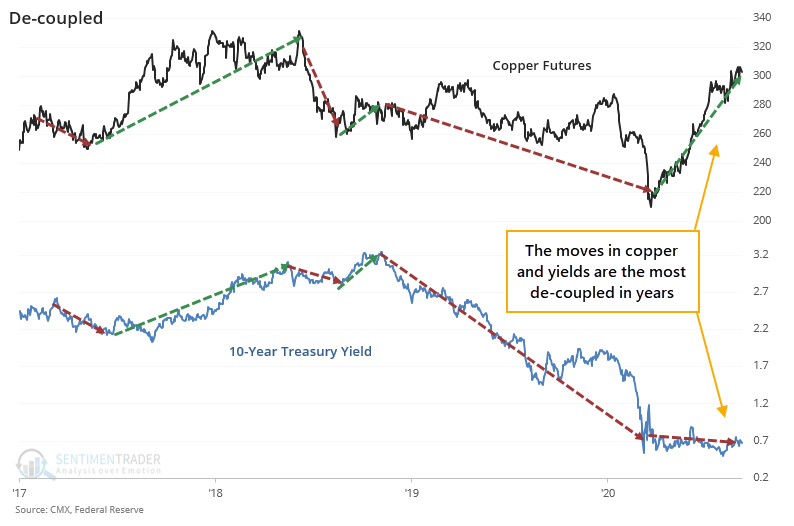
There have been a lot of head-scratching moves in 2020, most of them in the past several months. The cross-currents battling it out in all markets are astounding, and many have never been seen before. One of the most consistent relationships, which has broken down in recent months, is between the price of copper futures and the yield on 10-year Treasury notes.
The two don't move hand-in-hand, but historically they have had a tight positive correlation. The same influences which would push copper higher (industrial demand and economic growth) are the same that would push yields higher. Until lately.
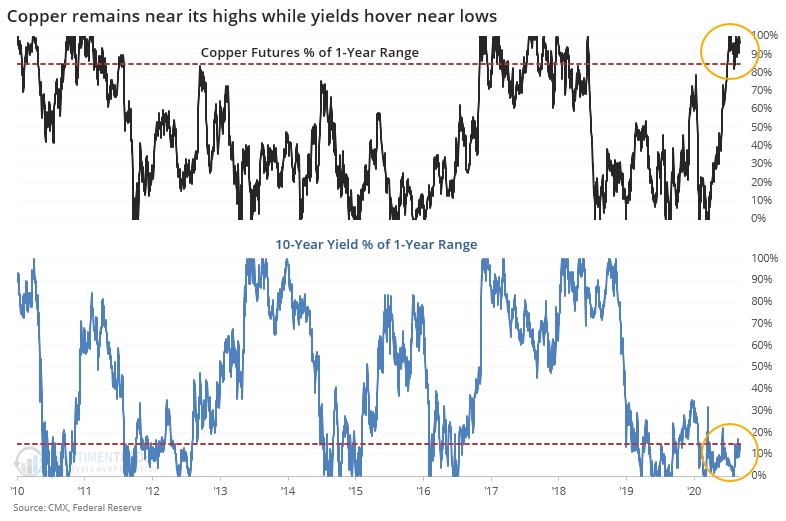
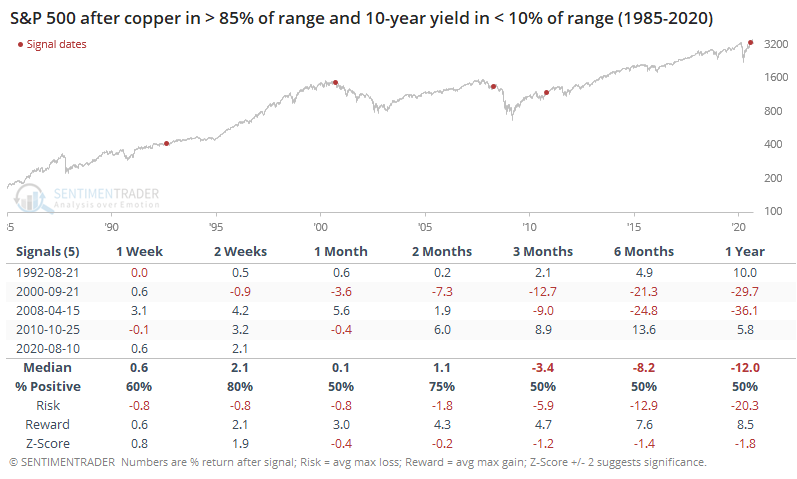
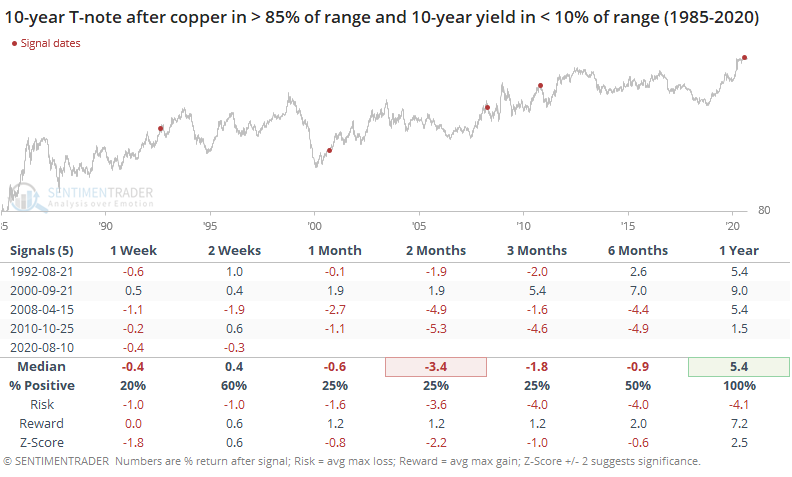
In recent months, copper has consistently held in the top 85% of its one-year range, while the 10-year yield has been stuck near the bottom 15% of its range.
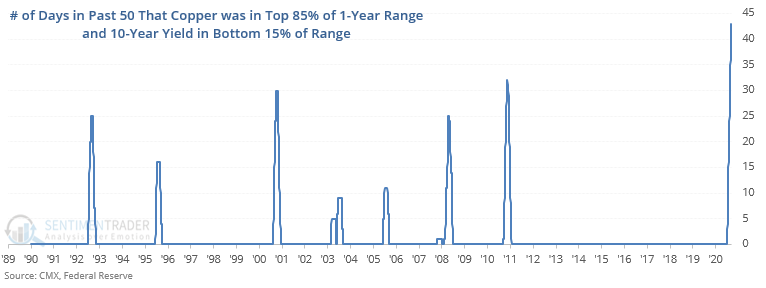
This has been going on for much of the past 50 days, which is by far a new record.
For stocks, this kind of divergence was a mixed blessing, with varied returns over the medium- to long-term.
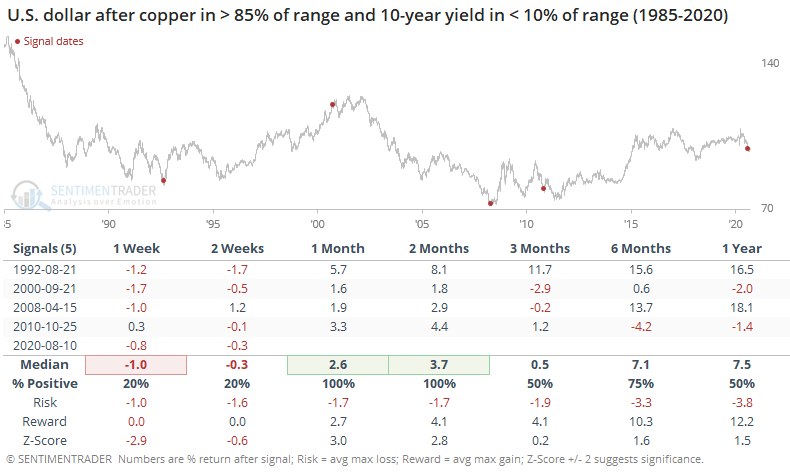
The dollar rebounded over the medium-term.
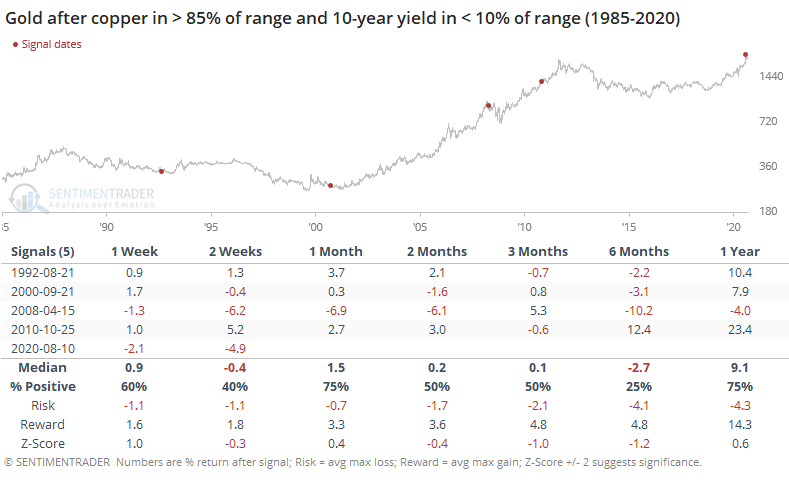
That was a headwind for gold but with only one large decline from 2008. The others saw rising prices longer-term.
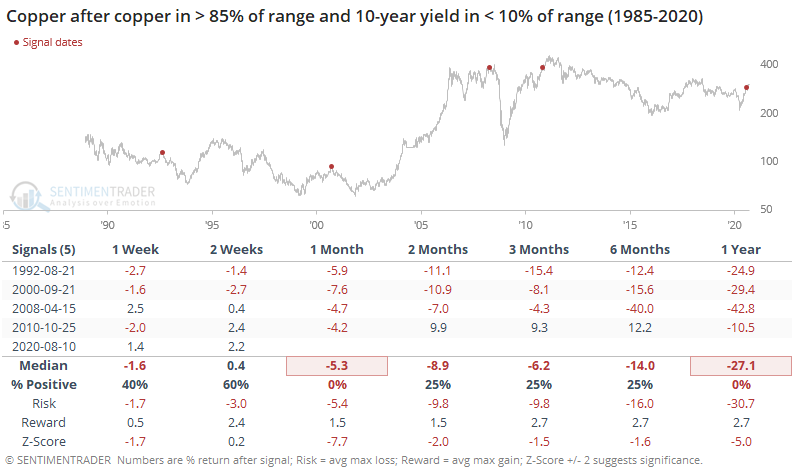
Copper itself took the brunt of the selling.
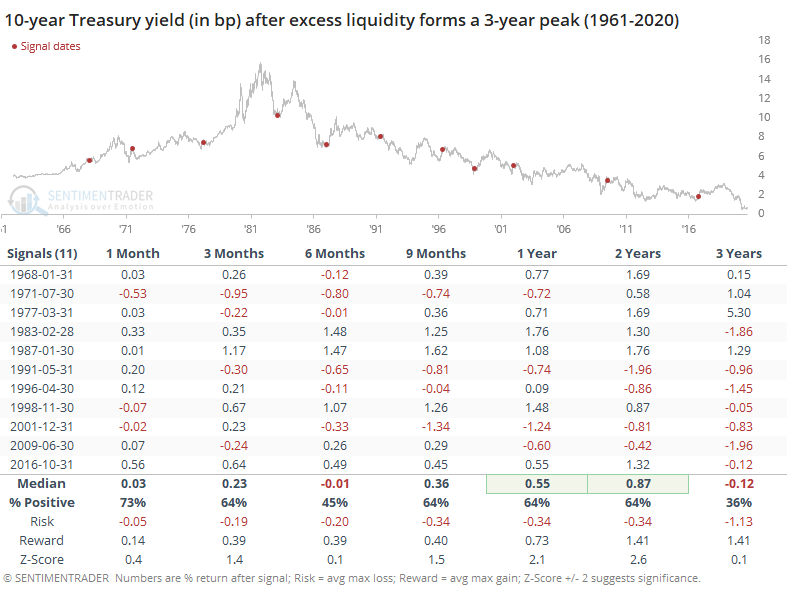
10-year Treasury futures also tended to decline (meaning yields rose) over the medium-term, but a year later bond prices were higher.
Excess Liquidity
The primary reason for the disconnect between yields and economically-sensitive instruments like copper are the fundamental factors of generous fiscal and monetary stimuli coupled with actively-suppressed interest rates.
As the Daily Shot highlighted, there is a record amount of excess liquidity in the system, defined by the year-over-year growth in M2 money supply minus the year-over-year growth in U.S. GDP.
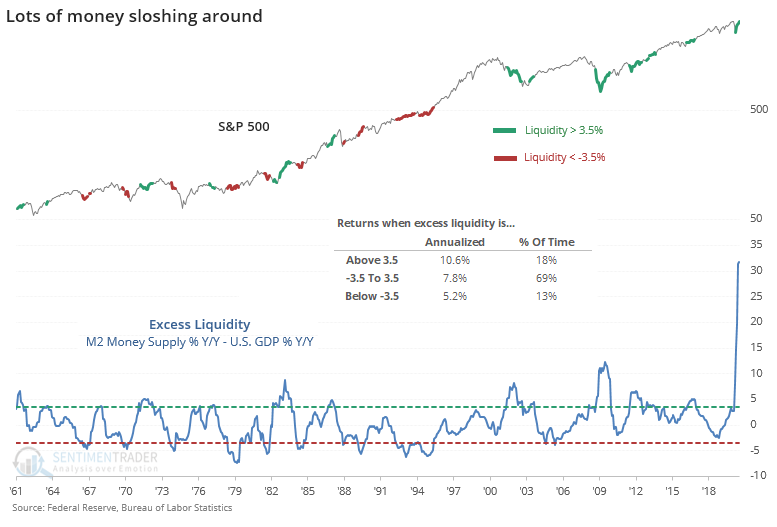
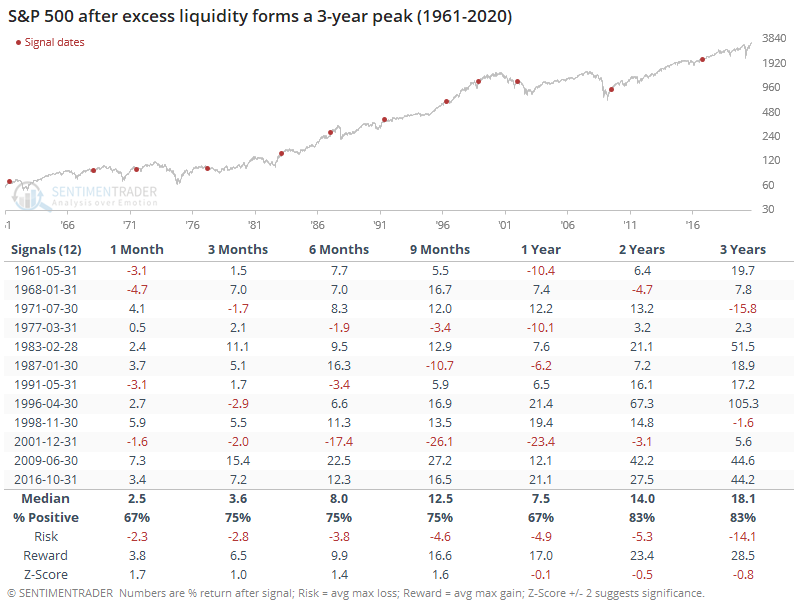
Stocks, and many other financial assets, tend to do well when excess liquidity is high. The issue is that it has already slowed down and has likely peaked.
That meant okay, but below average, long-term returns for stocks.
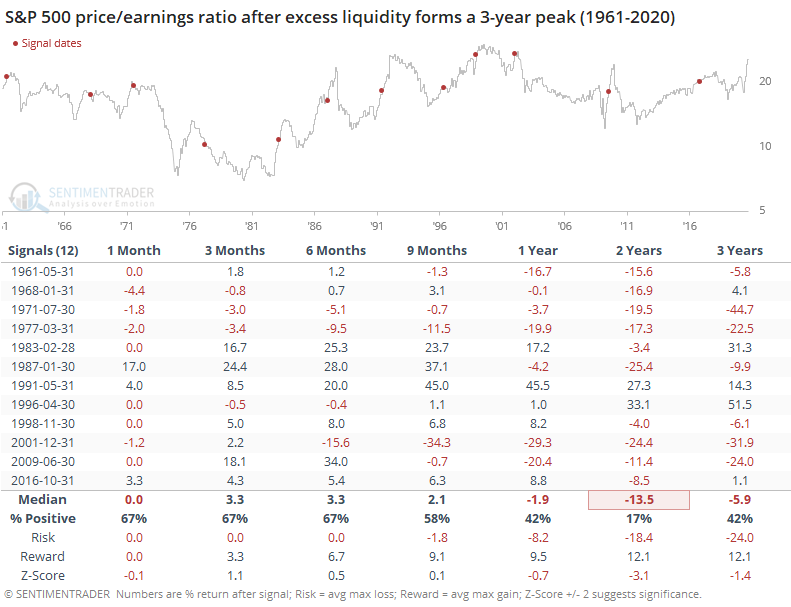
Perhaps most importantly, it led to a lower price/earnings multiple for the index. That's a particularly sensitive issue now since the P/E is at the upper end of its historical range. Only twice, in 1991 and 1996, did the S&P's multiple rise over a 2-year time frame, and both of those times the starting value was below 20.
The dollar tended to decline.
But that wasn't necessarily a big positive for gold.
The growth in inflation was positive, with some exceptions.
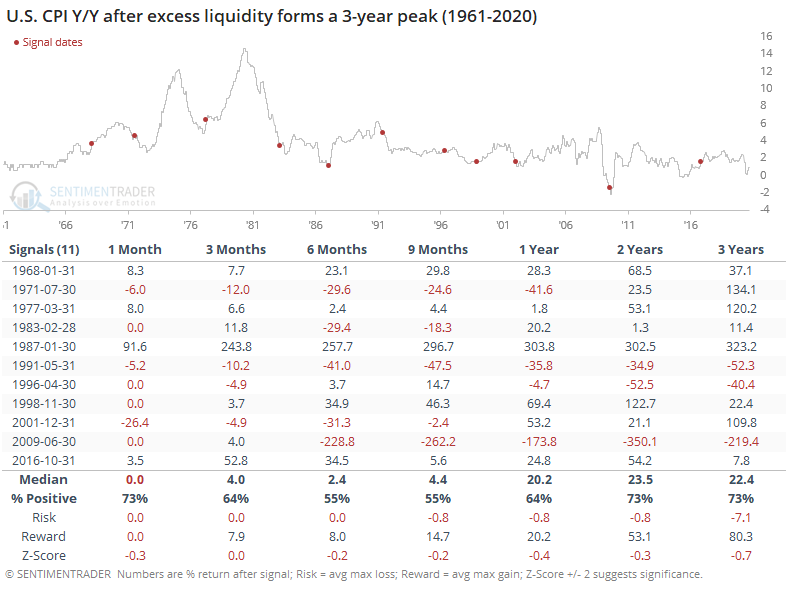
And that tended to coincide with a rise in 10-year yields.