Data &
Technology
Research
Reports
Report Solutions
Reports Library
Actionable
Strategies
Free
Resources
Simple Backtest Calculator
Simple Seasonality Calculator
The Kelly Criterion Calculator
Sentiment Geo Map
Public Research Reports
Free Webinar
Pricing
Company
About
Meet Our Team
In the News
Testimonials
Client Success Stories
Contact
Log inLoginSign up
< BACK TO ALL REPORTS

Medium term trend breadth

Troy Bombardia
2020-05-27
The continued rally in global equities has driven more and more stocks around the world into a medium-term uptrend.

The continued rally in global equities has driven more and more stocks around the world above their 50 dma. In the U.S., more than 90% of S&P 500 members are above their 50 dma.

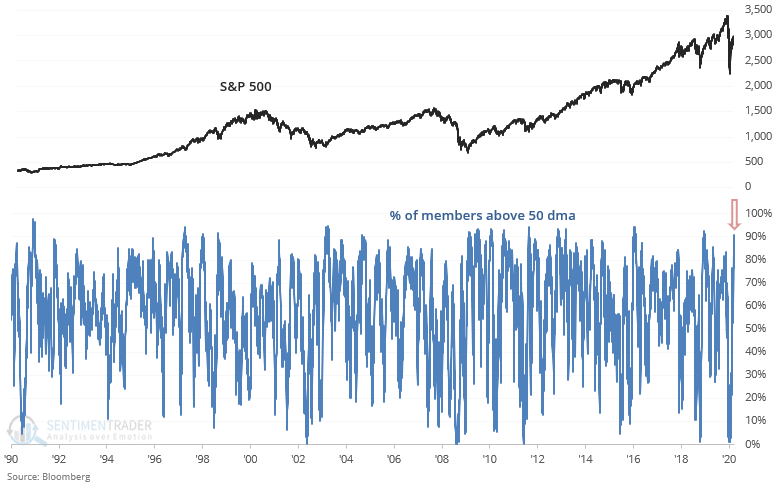
While it's easy to assume that this is a short term bearish factor for stocks, historically that has not been the case. The % of S&P members above their 50 dma does eventually fall, but it can fall by:

  1. The S&P pulling back, or
  2. The S&P swing sideways, allowing the 50 dma to catchup, or
  3. The S&P rally even more at a slower pace, allowing the 50 dma to catchup, and then make a pullback at a higher price

That's why when this happened historically, it wasn't consistently bearish for the S&P 500 on any time frame:

More than 83% of the NASDAQ Composite members are above their 50 dma:

This was a bullish sign as it occurred at the start of the 2003-2007 and 2009-2020 bull markets. However, it was also a bearish sign in January 2004:

For small caps, more than 85% of Russell 2000 members are above their 50 dma:

While the last 4 times this happened led to pullbacks for small cap stocks...

Before that it wasn't consistently bearish for small caps on any time frame:

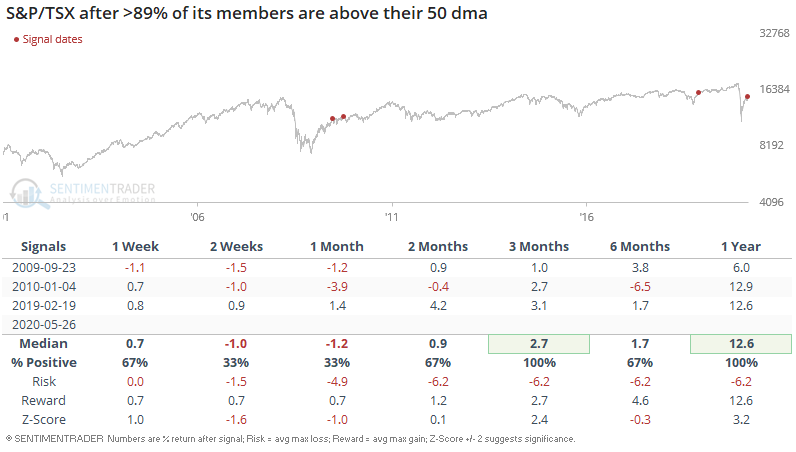
In Canada, more than 89% of S&P/TSX members are above their 50 dma:

This only happened during the 2009-2020 bull market, and led to more gains for Canadian equities over the next year:

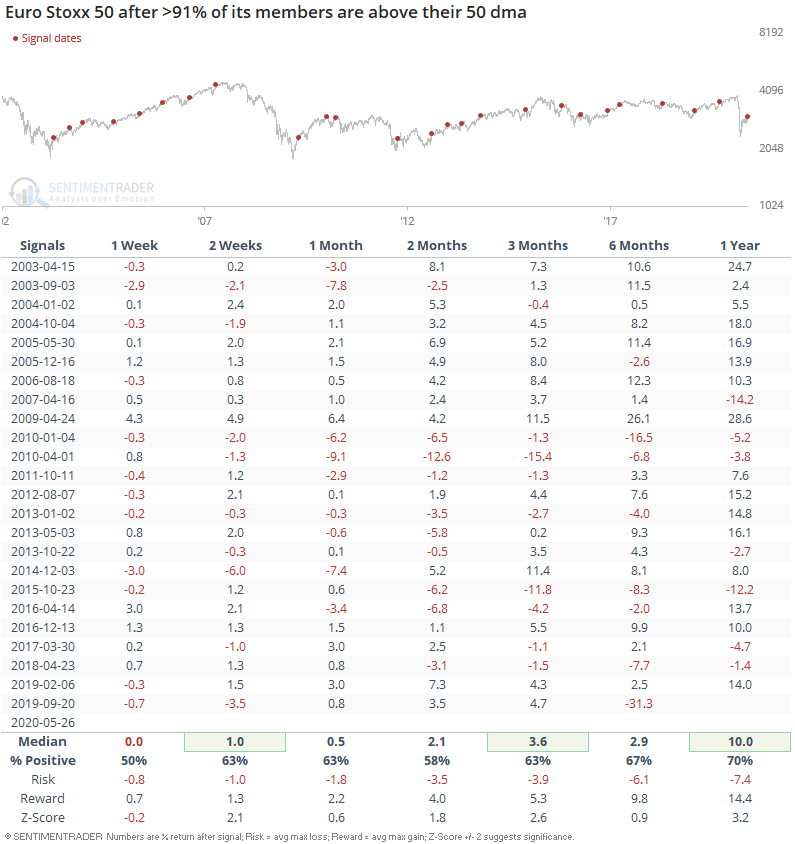
In Europe, more than 91% of Euro Stoxx members are above their 50 dma:


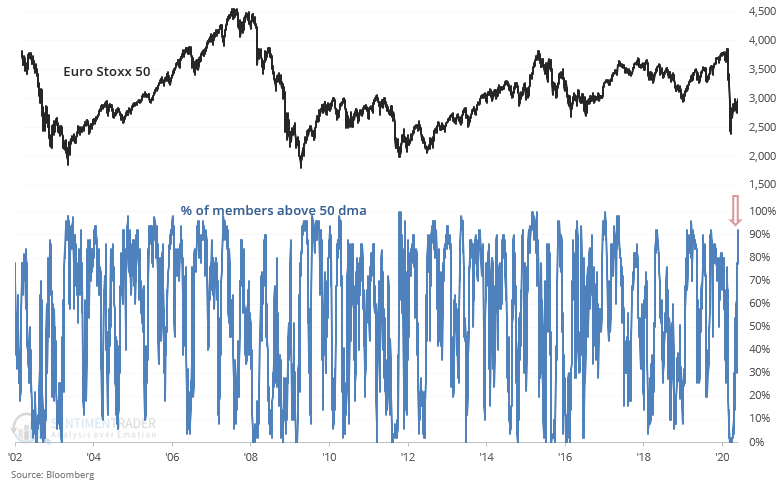
This led to better than average returns over the next year for European equities:

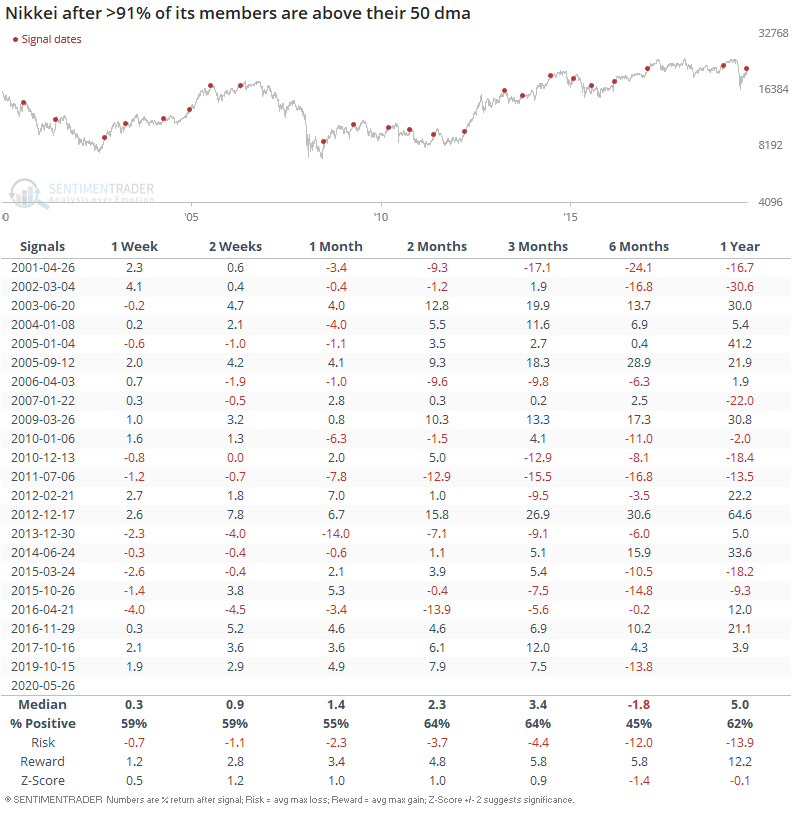
And in Japan, more than 91% of Nikkei 225 members are above their 50 dma:

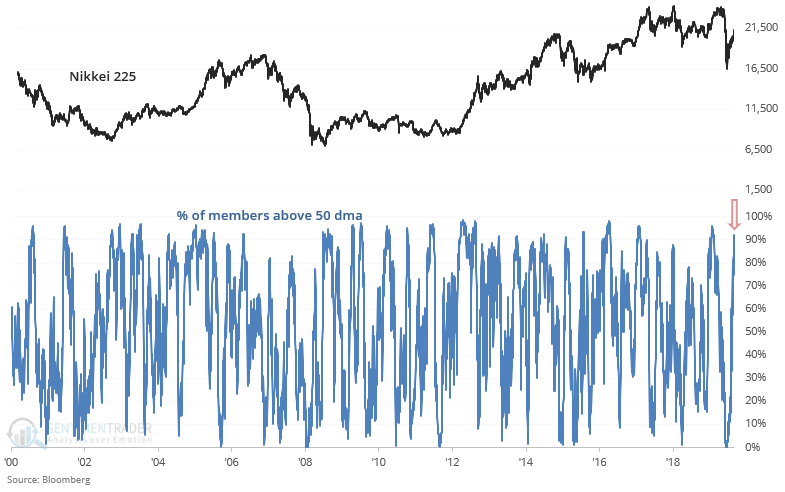
Returns over the next 6 months were more bearish than random:

Sorry, you don't have access to this report

Upgrade your subscription plan to get access
Go to Dasboard
DATA &
TECHnologies
IndicatorEdge
‍
BackTestEdge
‍
Other Tools
‍
DataEdge API
RESEARCH
reports
Research Solution
‍
Reports Library
‍
actionable
Strategies
Trading Strategies
‍
Smart Stock Scanner
‍
FREE
RESOUrCES
Simple Backtest
Calculator
Simple Seasonality
Calculator
The Kelly Criterion
Calculator
Sentiment Geo Map
‍
Public Research Reports
‍
Free Webinar
COMPANY
‍
About
‍
Meet our Team
‍
In the News
‍
Testimonials
‍
Client Success Stories
Pricing
Bundle pricing
‍
Announcements
‍
FAQ
© 2024 Sundial Capital Research Inc. All rights reserved.
Setsail Marketing
TermsPrivacyAffiliate Program
Risk Disclosure: Futures and forex trading contains substantial risk and is not for every investor. An investor could potentially lose all or more than the initial investment. Risk capital is money that can be lost without jeopardizing ones’ financial security or life style. Only risk capital should be used for trading and only those with sufficient risk capital should consider trading. Past performance is not necessarily indicative of future results.

Hypothetical Performance Disclosure: Hypothetical performance results have many inherent limitations, some of which are described below. No representation is being made that any account will or is likely to achieve profits or losses similar to those shown; in fact, there are frequently sharp differences between hypothetical performance results and the actual results subsequently achieved by any particular trading program. One of the limitations of hypothetical performance results is that they are generally prepared with the benefit of hindsight. In addition, hypothetical trading does not involve financial risk, and no hypothetical trading record can completely account for the impact of financial risk of actual trading. for example, the ability to withstand losses or to adhere to a particular trading program in spite of trading losses are material points which can also adversely affect actual trading results. There are numerous other factors related to the markets in general or to the implementation of any specific trading program which cannot be fully accounted for in the preparation of hypothetical performance results and all which can adversely affect trading results.

Testimonial Disclosure: Testimonials appearing on this website may not be representative of other clients or customers and is not a guarantee of future performance or success.