Massive Sell Programs; Hard, Fast Pullback, Near-Record Negative Momentum

This is an abridged version of our Daily Report.
Everybody out
During the past 3 weeks, we’ve seen a near-record amount of sell programs at some point during the trading day.
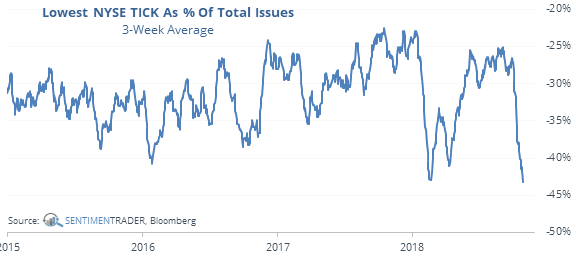
The lowest NYSE TICK during that stretch is now the 2nd most extreme in history, with an average of more than a net 40% of NYSE securities trading on a downtick. We don’t necessarily know who is selling on a daily basis, and whether they are smart or dumb money. The so-called Smart Money Index that monitors price activity during the morning vs afternoon is not an effective guide, due to the relatively new phenomenon of ETF providers dominating trading during the last half-hour, which wasn’t a factor before.
A fast, hard pullback
The S&P dropped more than 9% in only 26 days from its 52-week high in September. That’s among the largest pullbacks ever for this time span.
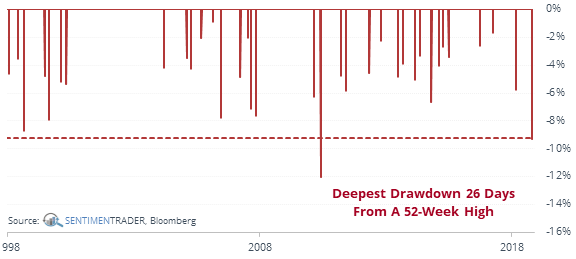
We’ve been taught to believe that high volatility often marks the peak of a bull market, but that is demonstrably false. This would be atypical for a bear market, which has seen slower, calmer beginnings.
Persistent negative momentum
The McClellan Oscillator hasn’t been positive for almost two months. That’s the 2nd longest streak in history, usually indicating oversold conditions.
Waterfall
When the spread between Smart and Dumb Money Confidence is greater than 50% and the S&P closes at a multi-month low, buying the close and exiting at the first positive close led to 90% winning trades (26 of 29) within one week and 100% within two weeks.
Turnaround Tuesday
If the S&P lost at least 2% during a down Friday/down Monday, it rebounded into Friday 68% of the time (79 out of 116 times) by an average of 1.1% since 1928.