
Market overview: not QE
With the U.S. stock market rallying back towards all-time highs, here's my market outlook:
- Long term risk:reward doesn’t favor bulls. Valuations are high, but valuations can remain high for years before stocks crash.
- Fundamentals (6-12 months): still bullish because there is no significant U.S. macro deterioration.
- Technicals (3-6 months): neutral/bullish
- Technicals (1-2 months): bearish
Fundamentals (6-12 months)
The economy and the stock market move in the same direction in the long term. Hence, leading economic indicators are also long term leading indicators for the stock market.
Overall, there is no significant U.S. economic deterioration right now. This is bullish for the stock market on a 6-12 month time frame. The main weak points in U.S. macro revolve around trade, manufacturing, and the yield curve. For more details and charts, please see my weekly fundamentals post.
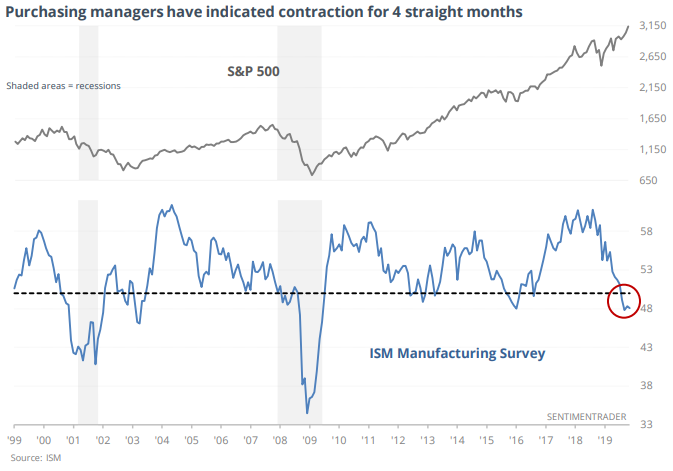
With that being said, manufacturing continues to be the main weak point in the U.S. economy. Jason mentioned that ISM Manufacturing PMI has been in contraction mode for 4 months while the S&P is close to an all-time high.
Since this often (but not always) happened within the context of a recession, the S&P's returns over the next few weeks and months were consistently worse than random.

On the plus side, U.S. financial conditions according to Goldman Sachs continue to ease:
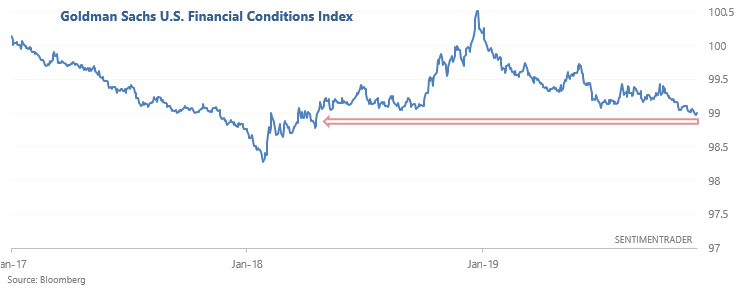
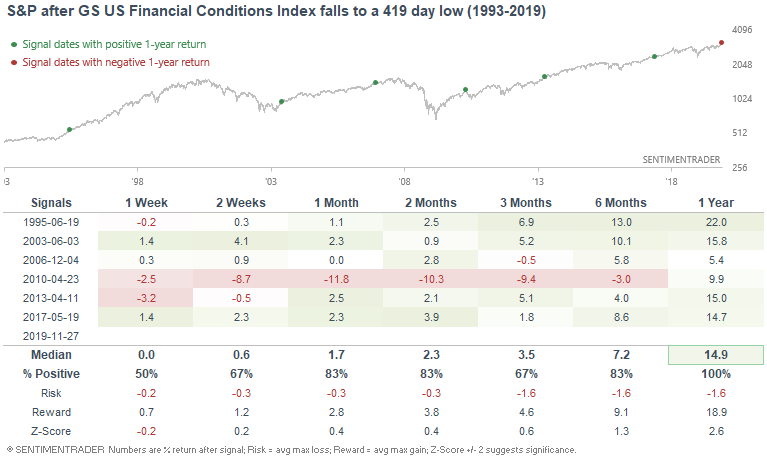
As one would expect, easing financial conditions in a credit-driven economy has generally been a good sign for stocks over the next year:
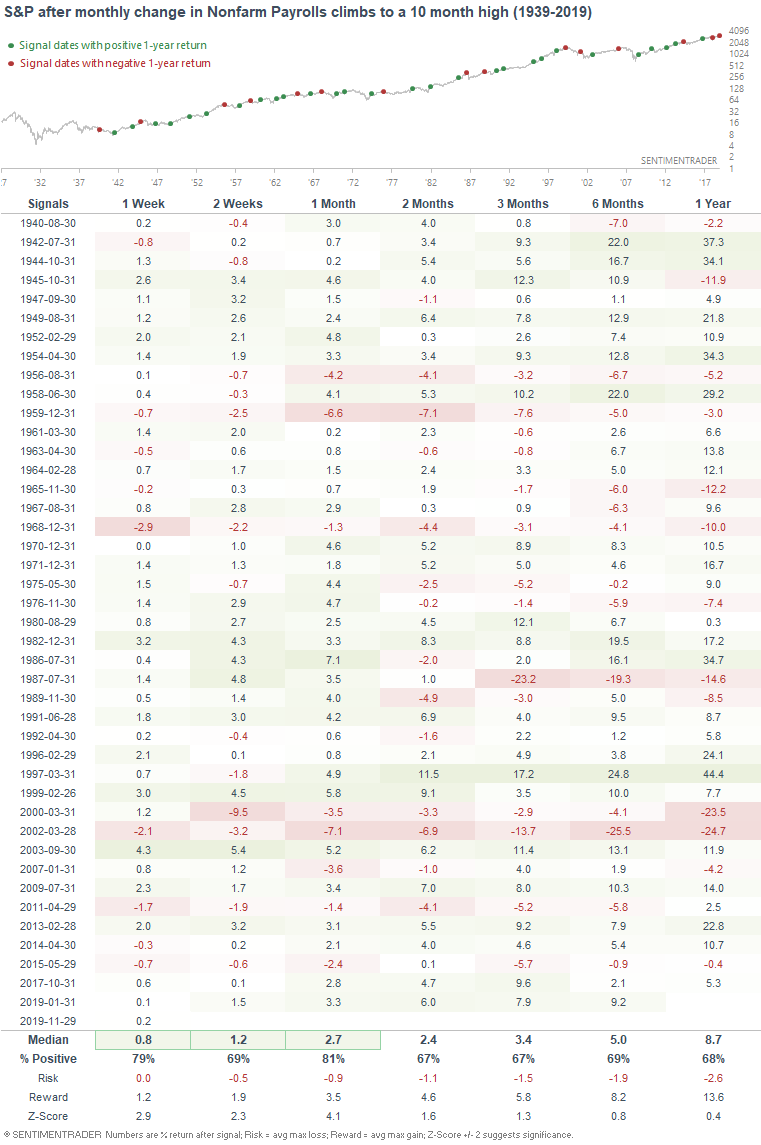
And as Ryan Detrick noted, the recent strength in nonfarm payrolls isn't what you typically see infront of a recession.
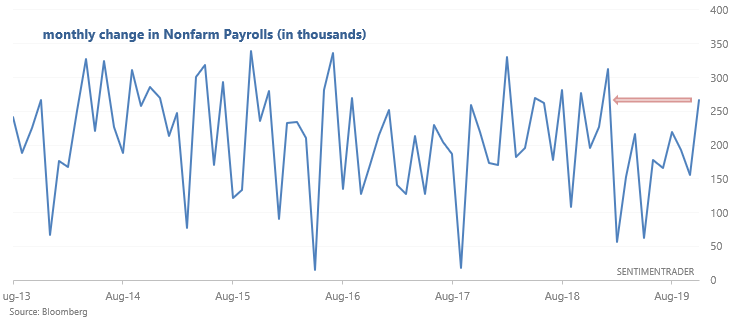
When the monthly change in Nonfarm Payrolls jumped to a 10 month high, the S&P usually rallied over the next month as investors' fear of a recession subsided. Perhaps this is why stocks jumped on Friday:
*I don't like to predict or explain day-to-day movements in the market.
Technicals (3-6 months)
The majority of our stats suggest that the stock market's 3-6 month outlook is bullish, although there are some bearish stats as well. Let's start with the bullish stats, and then we'll look at the bearish ones.
Bullish:
Momentum
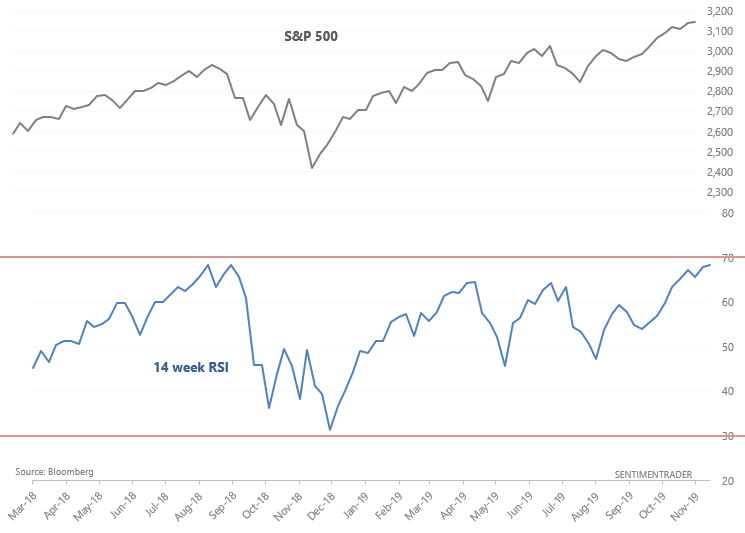
The stock market's momentum remains strong, which typically leads to more gains over the next 6-12 months. With the S&P 500 back near its all-time highs, its 14 weekly RSI is now at 68. Just another week's rally, and the S&P will probably become overbought for the first time since last September.
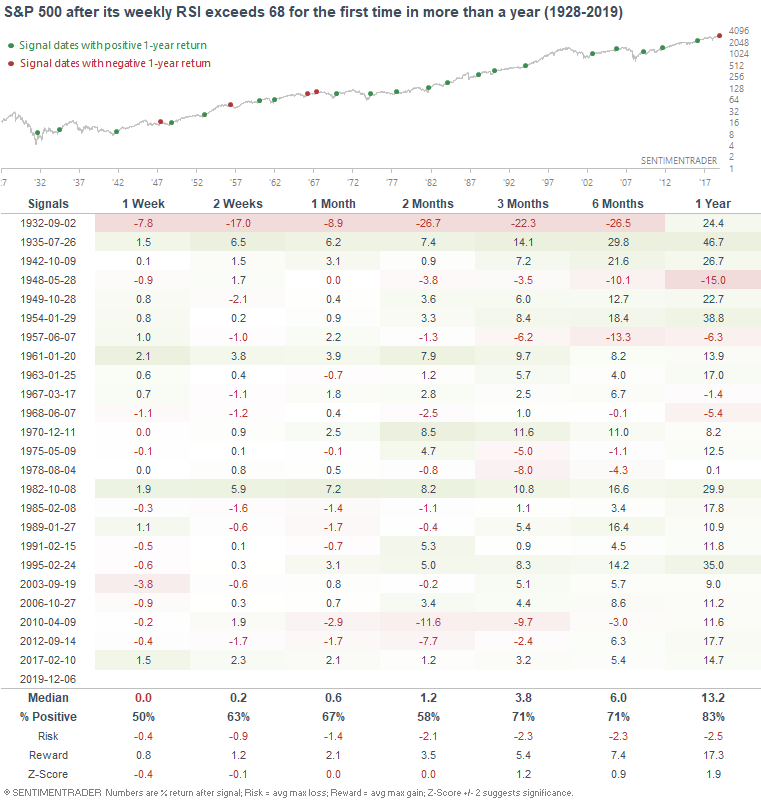
When the S&P became close to "overbought" (at least according to the popular RSI indicator) for the first time in more than a year, it typically continued to rally over the next year.
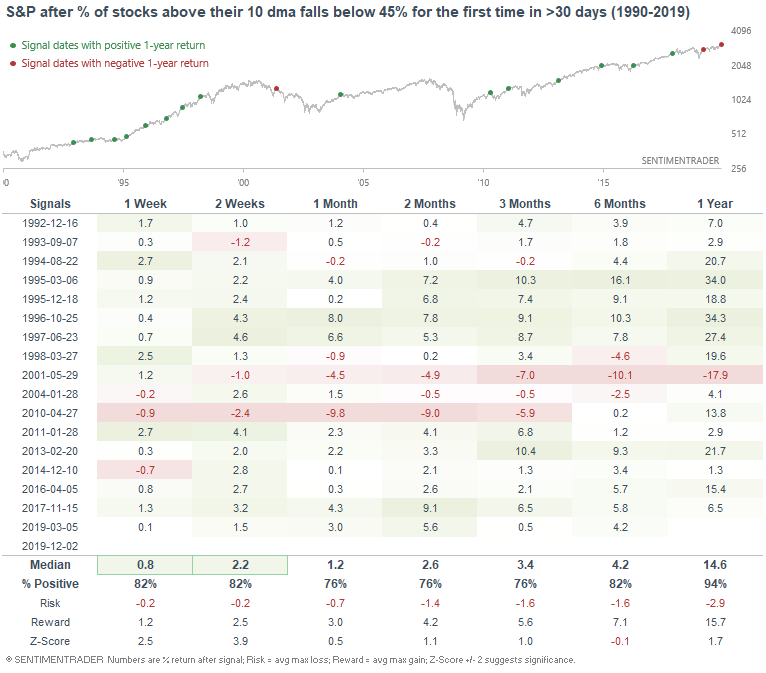
And as I mentioned on Tuesday, the stock market's early-week dip was the first dip in a long time:
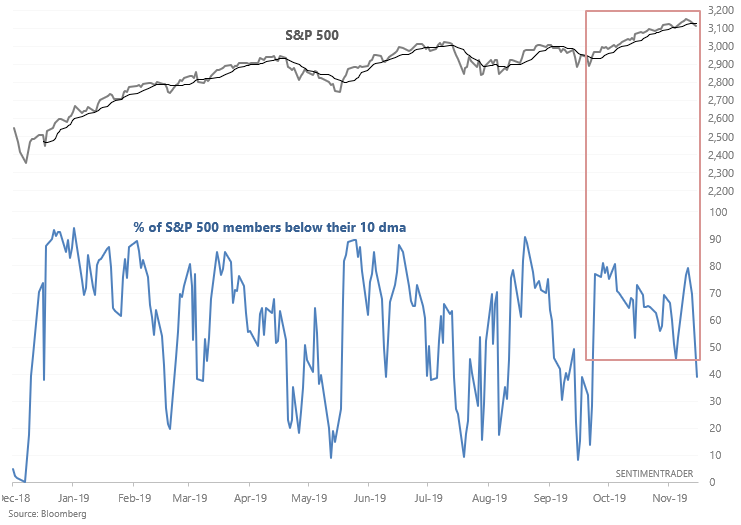
When a significant portion of the S&P's members fall for the first time in a long time, it usually keeps rallying over the next year. The one exception was in May 2001, when the U.S. stock market was significantly below all-time highs and the economy was already in a recession.
Fed easing
As Bloomberg TV noted, the Fed is expanding its balance sheet at the fastest pace since QE3.
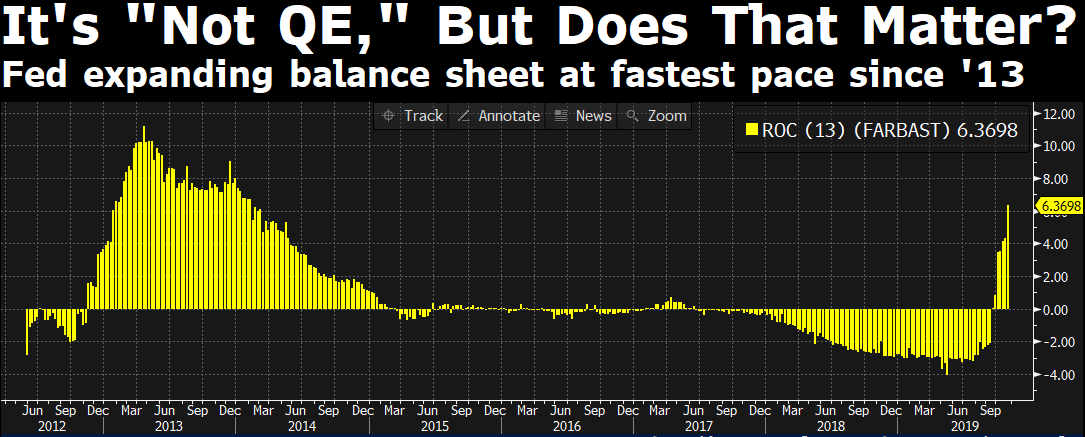
As one would expect, an expanding balance sheet has typically been a good sign for stocks. Here's a longer term look at this chart:
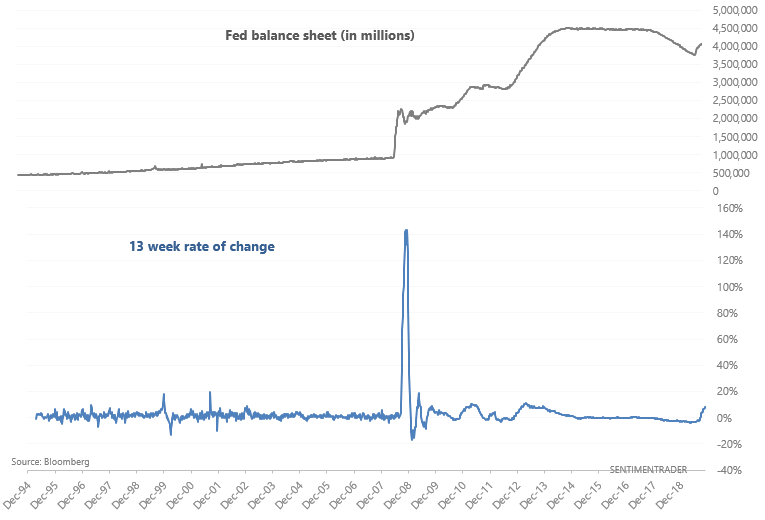
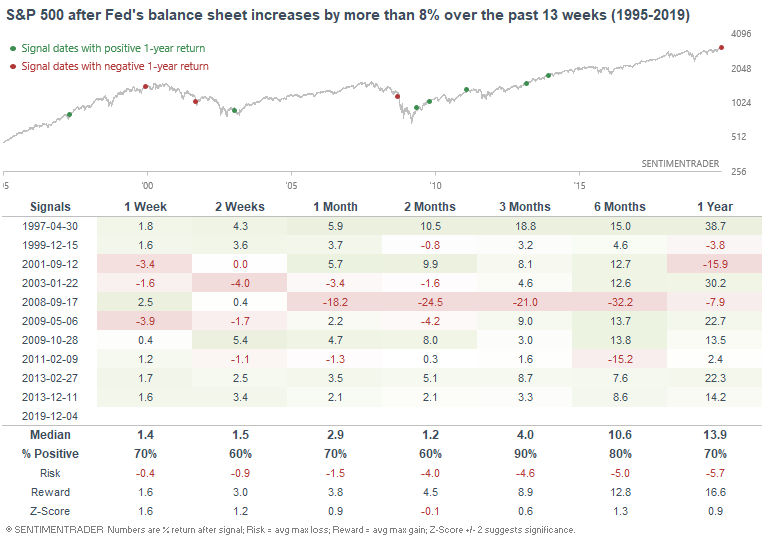
When the Fed's balance sheet started to expand in the past, the S&P almost always rallied over the next 3 months. The one major exception was in 2008, when nothing that the Fed did could stop the recession and stock market crash. Given the completely different macroeconomic environment between today and September 2008, I don't think that historical case applies to today.
Neutral/bearish:
High yield spreads
As Jason noted on Friday, the spread between the lowest-rated debt and higher-rated debt has expanded to the highest level since 2016:
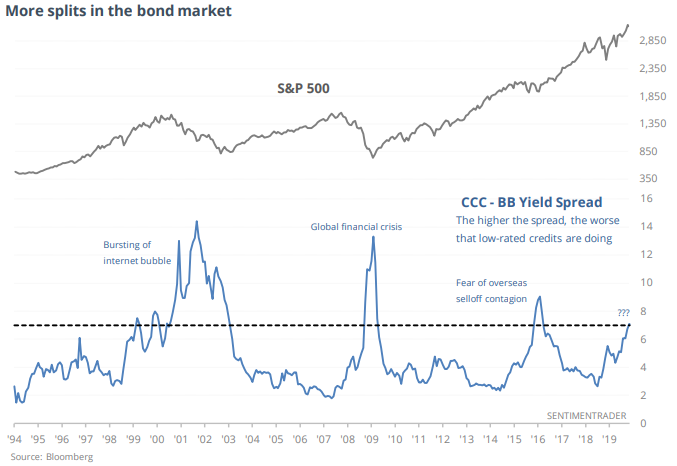
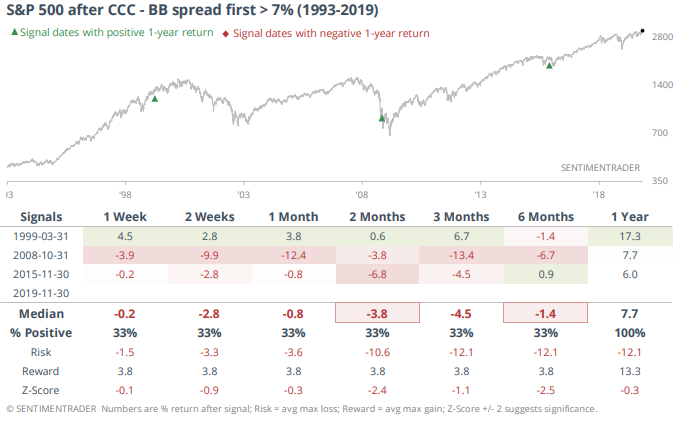
Perhaps this is related to continued woes in the energy sector, but this hasn't been a particularly good sign for stocks. The prior 3 historical cases occurred around periods of market and economic turbulence:
More breadth & sentiment warnings
As I mentioned on Wednesday, the Titanic Syndrome triggered again:
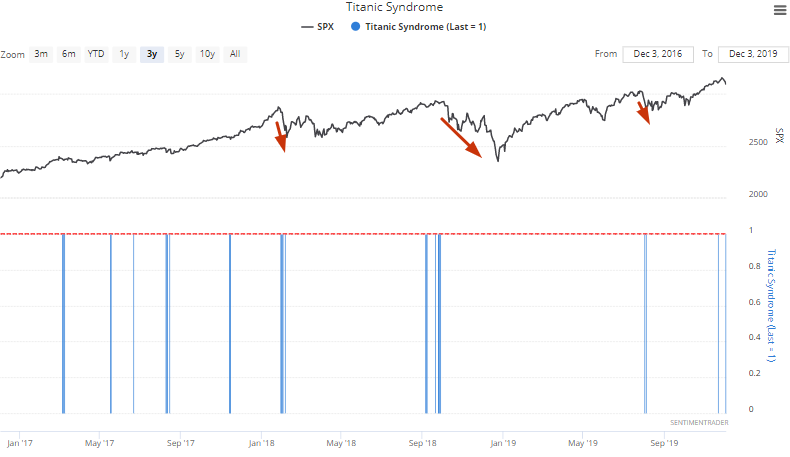
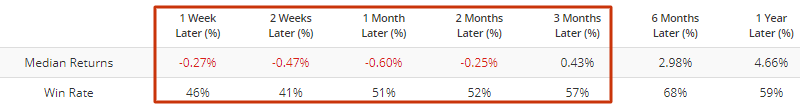
Overall, this has led to consistently worse-than-average returns for stocks going forward:
I also noted on Tuesday that the Advisor & Investor Model (an aggregate of sentiment readings) was recently at the highest level since late-April 2019, just before stocks fell.
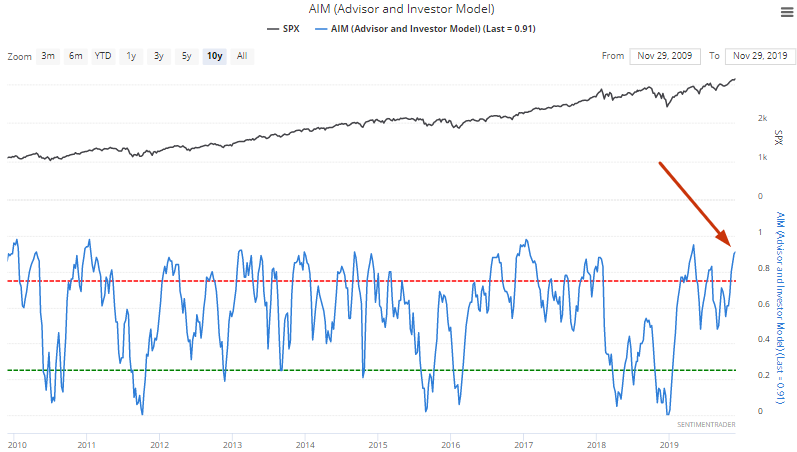
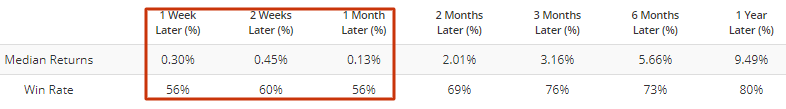
This has typically led to worse than random returns over the next month:
Technicals (1-2 months)
*The stock market's short term outlook is hard to predict, no matter how much confidence you have in a prediction. Too many exogenous and unpredictable factors can impact the short term.
Bearish:
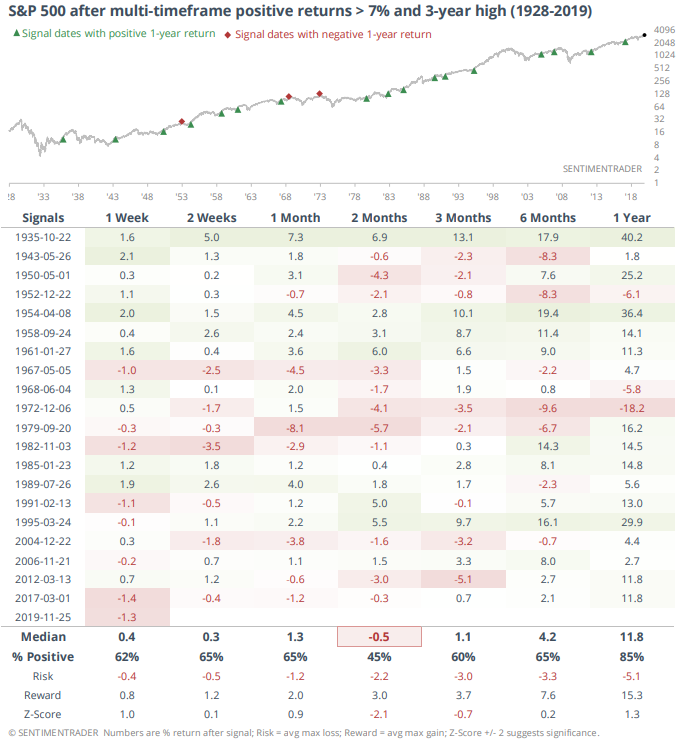
As Jason mentioned on Thursday, U.S. stocks have surged on almost all time frames:
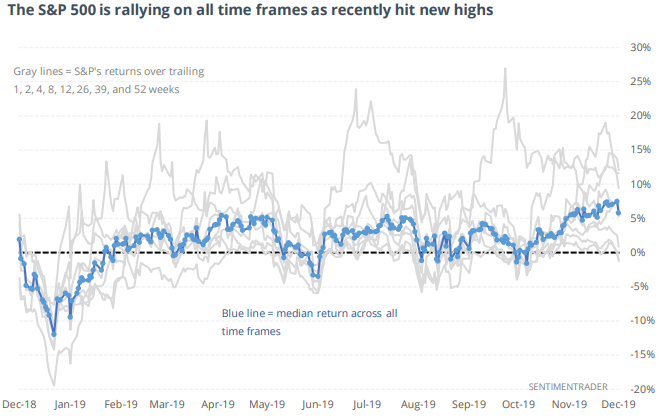
When buying pressure was this strong in the past, the S&P often struggled over the next 2 months. But as is the case with most momentum studies, this isn't typically how bull markets end, which is why the S&P's returns over the next year were mostly bullish:
To recap
- Long term risk:reward doesn’t favor bulls.
- Fundamentals (6-12 months): still bullish because there is no significant U.S. macro deterioration.
- Technicals (3-6 months): neutral/bullish
- Technicals (1-2 months): bearish
Got any questions? Feel free to contact me at [email protected]