Market & fundamentals overview: post-trade war rally?
With the U.S. stock market making new all-time highs on trade war developments, here's my market outlook:
- Long term risk:reward doesn’t favor bulls. Valuations are high, but valuations can remain high for years before stocks crash.
- Fundamentals (6-12 months): still bullish because there is no significant U.S. macro deterioration.
- Technicals (3-6 months): neutral/bullish
- Technicals (1-2 months): bearish
Fundamentals (6-12 months)
The economy and the stock market move in the same direction in the long term. Hence, leading economic indicators are also long term leading indicators for the stock market.
Overall, there is no significant U.S. economic deterioration right now. This is bullish for the stock market on a 6-12 month time frame. The main weak points in U.S. macro revolve around trade, manufacturing, and the yield curve. For more details and charts, please see the bottom of this post.
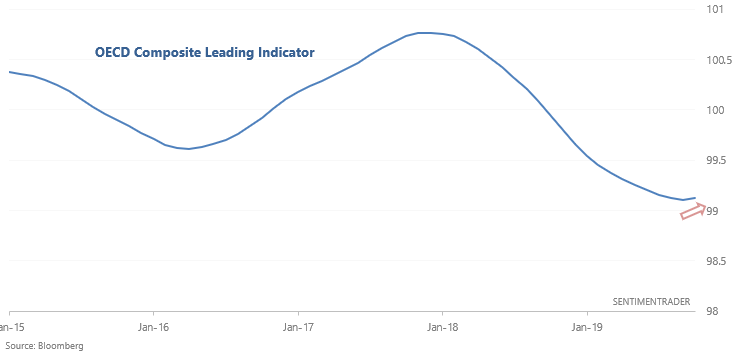
With that being said, some weak global economic indicators are starting to improve. For example, I noted on Wednesday that the OECD Composite Leading Indicator turned up for the first time in more than 1.5 years:
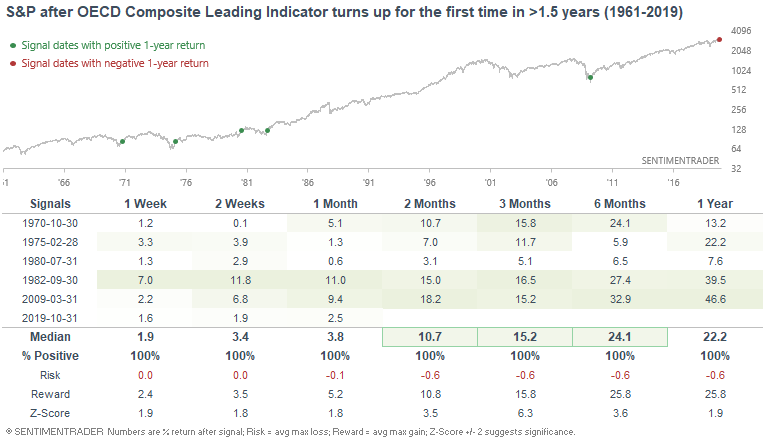
Since this usually happened after a recession and bear market, the S&P's returns over the next year were typically explosive:
Technicals (3-6 months)
The majority of our stats suggest that the stock market's 3-6 month outlook is bullish, although there are some bearish stats as well. Let's start with the bullish stats, and then we'll look at the bearish ones.
Bullish:
High yields
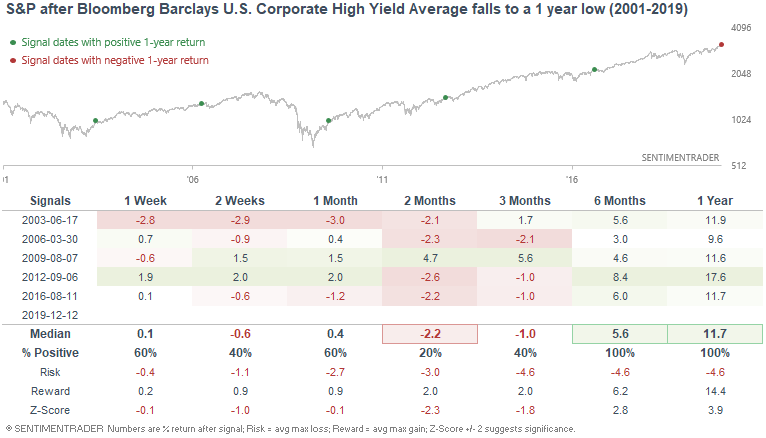
As Lisa Abramowicz mentioned, junk bonds have rallied significantly over the past few months, pushing their yields to the lowest level in over a year:
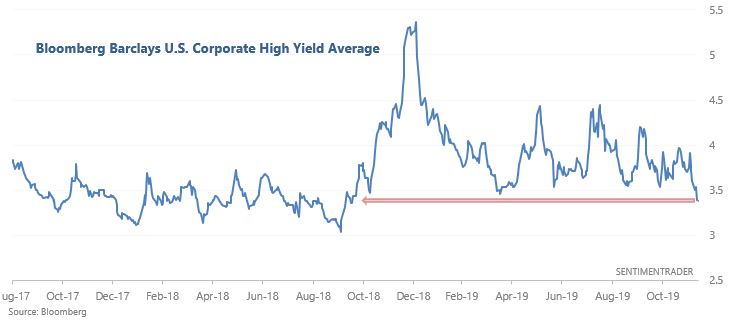
Since this figure usually trends higher before major periods of market and economic turbulence, cases in which this figure fell to a 1 year low were usually followed by stock market gains over the next 6-12 months, even though it often led to losses over the next 2 months:
Breakouts
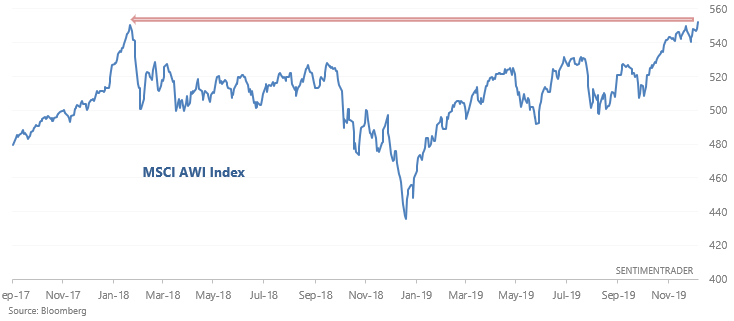
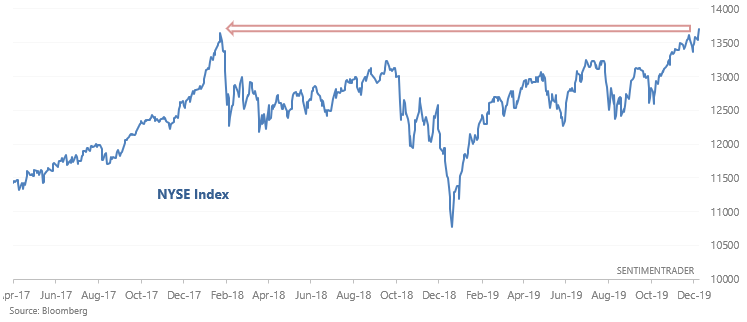
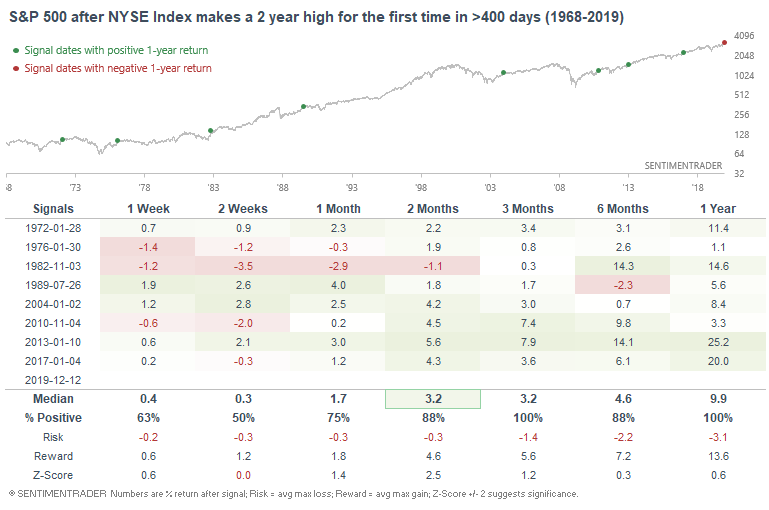
As I mentioned on Friday, both the MSCI AWI Index and NYSE Index broke out to new highs:
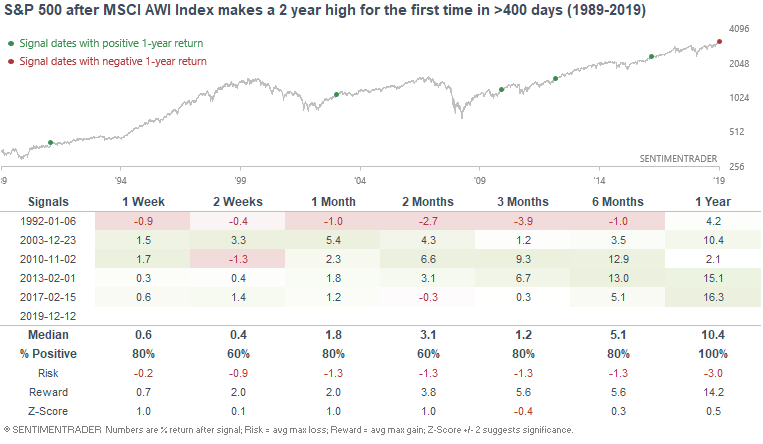
This was typically bullish for their respective indices over the next 6-12 months, and particularly bullish for the S&P 500:
Breadth
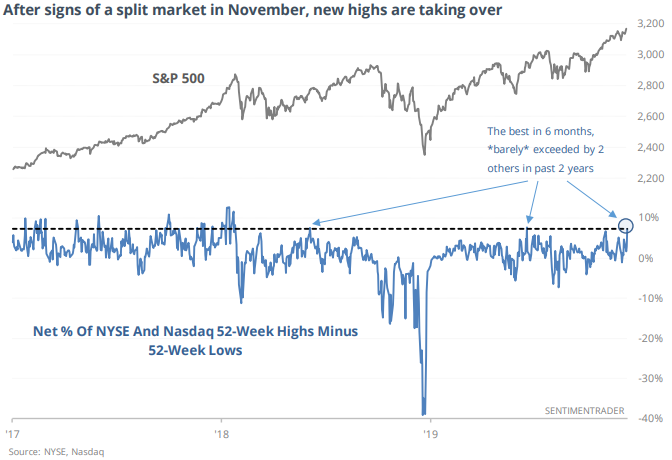
As Jason noted on Friday, there was a surge this Thursday in the net % of securities on the NYSE and NASDAQ making new 52 week highs:
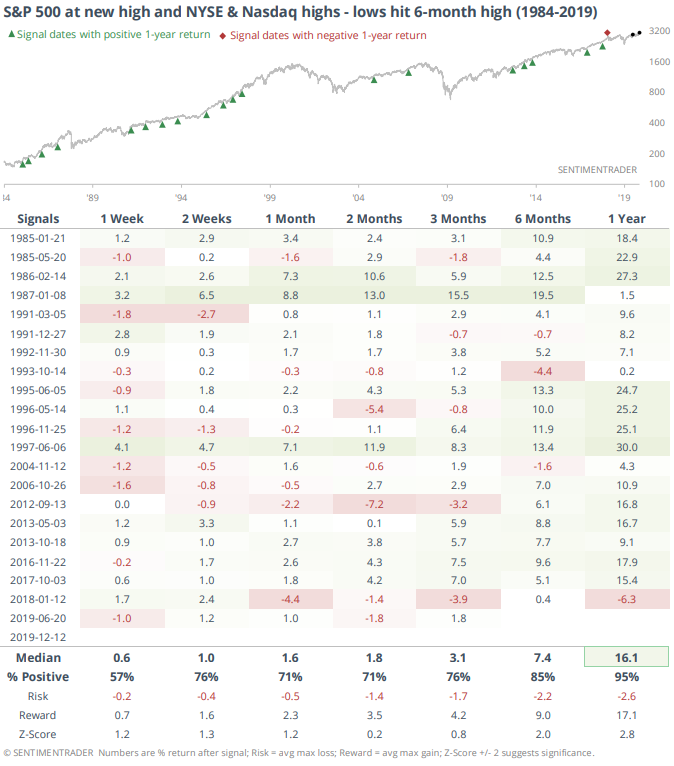
This has almost always been a positive for stocks over the next year, with the one exception being last year when stocks plunged in Q4:
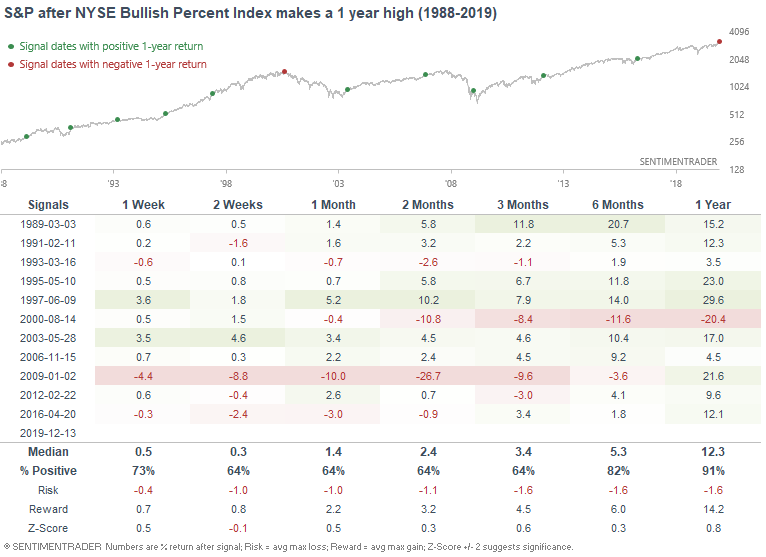
Meanwhile, the NYSE Bullish Percent Index - a breadth indicator based on point & figure buy signals - climbed to the highest level since June 2018:
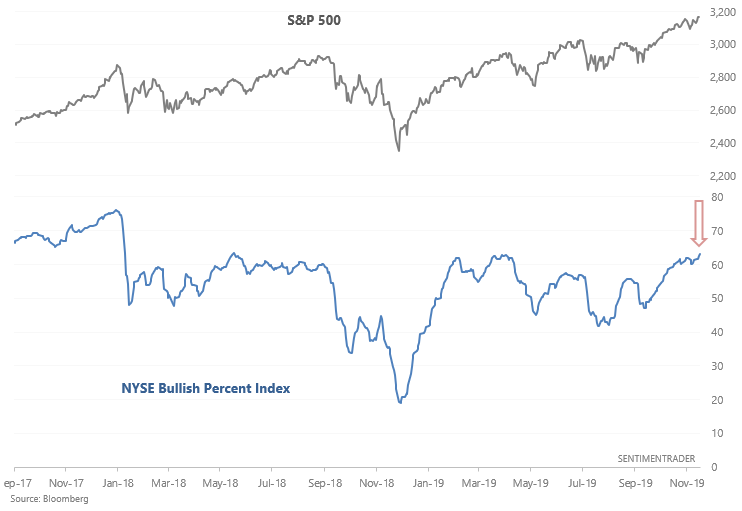
Historically, these breadth breakouts led to mixed signals in the coming weeks and months, but were almost all bullish over the next year:
Fund flows
In a terrific study on Monday, Jason demonstrated that while fund outflows are massive in nominal terms ("it's just like the bottom of 2008"), as a % of assets it isn't that extreme:
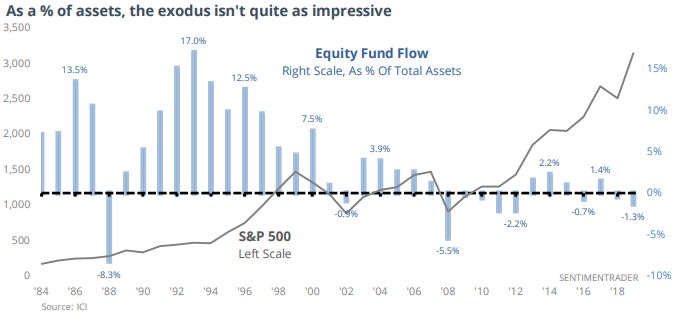
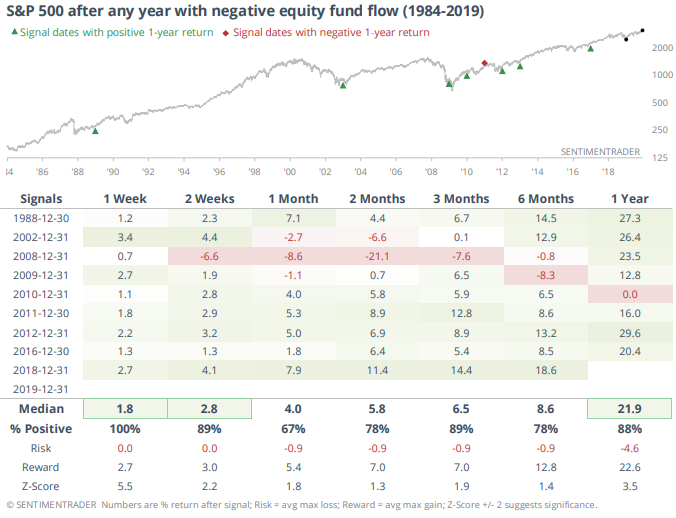
Still, an outflow is an outflow, and years with outflows were typically followed by strong rallies over the next year:
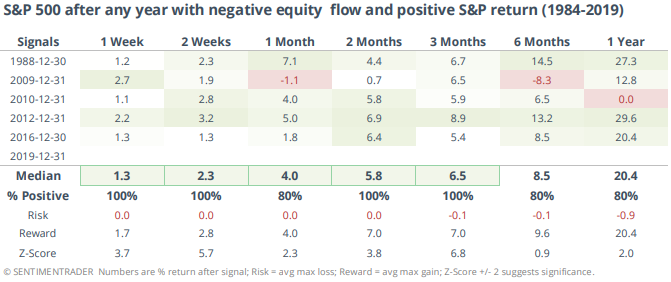
In a more apples-to-apples comparison, Jason looked at years in which there was an outflow despite a rally in stocks. Risk:reward was even better:
Neutral/bearish:
Lack of volatility
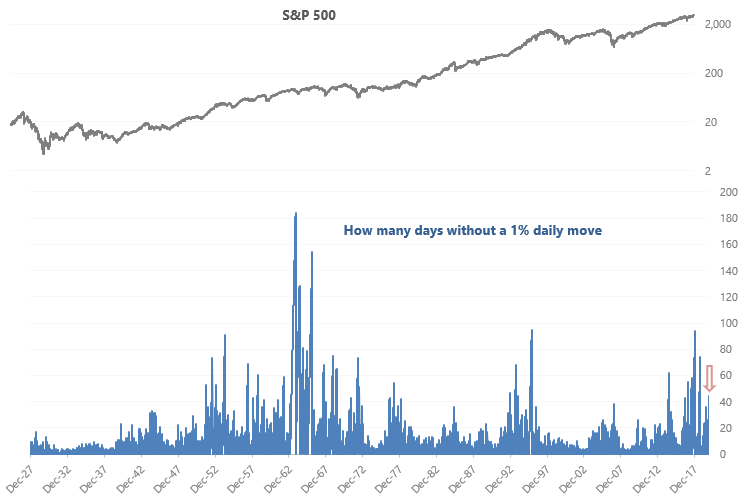
As Bloomberg and plenty of other market watchers continue to note, the S&P has spent many days without a +/- 1% daily move (using daily CLOSE prices):
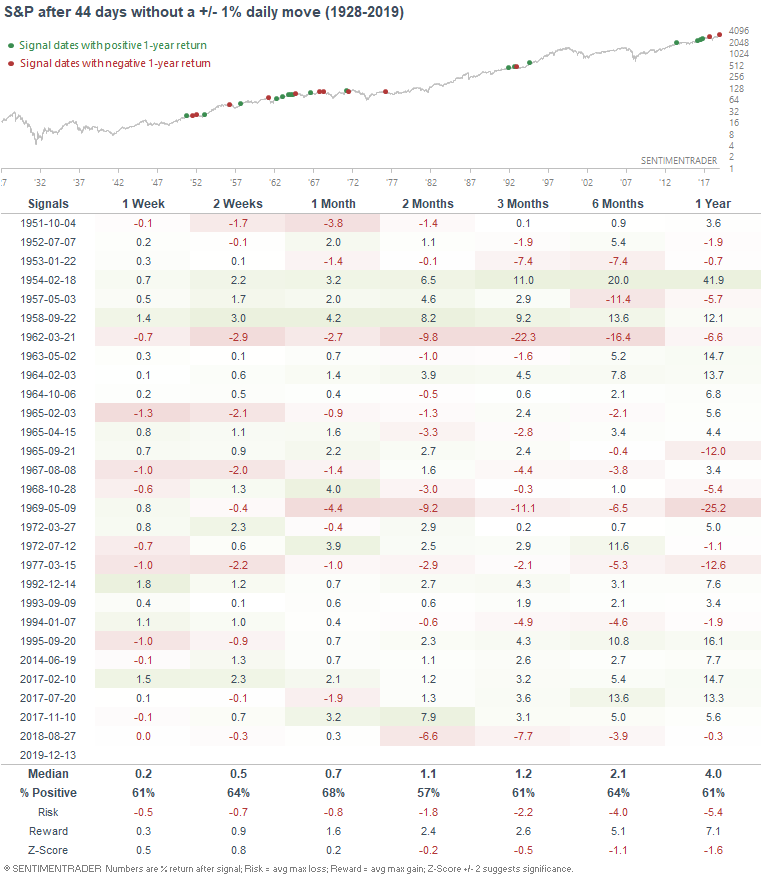
This usually led to a minor bearish lean for stocks over the next few months, although the edge isn't particularly strong:
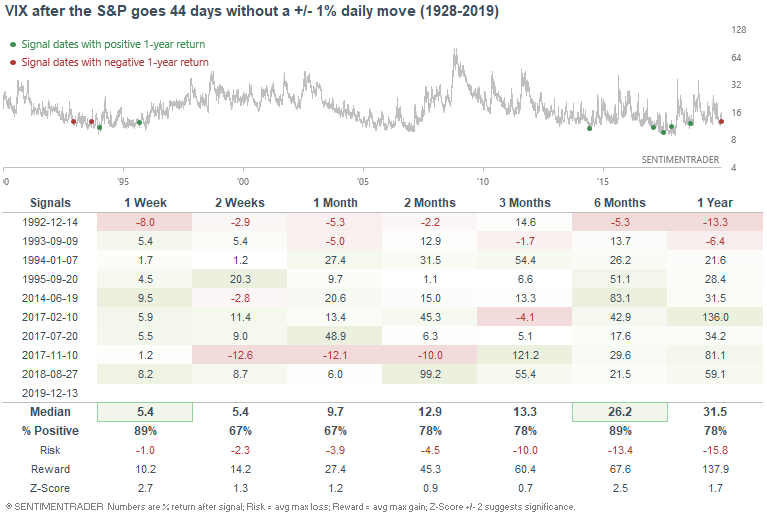
The stronger edge lies with VIX, which has a tendency to spike over the next few weeks and months:
Hedge fund exposure
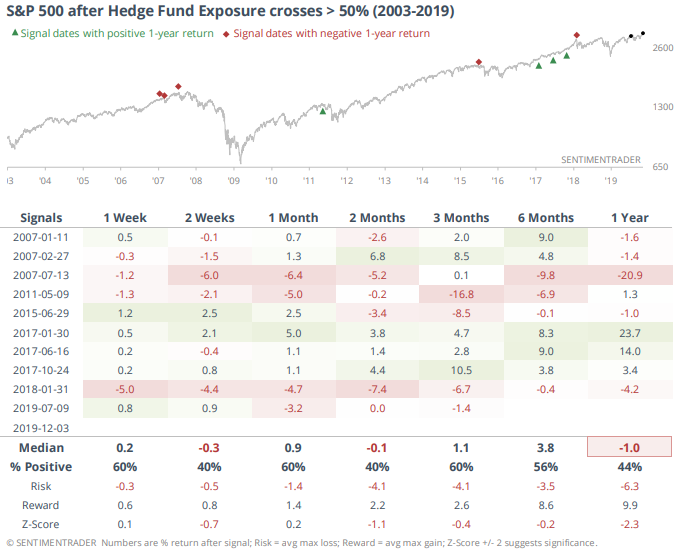
As Jason mentioned on Tuesday, hedge funds recently ramped up their exposure to equities after being underexposed for much of this year:
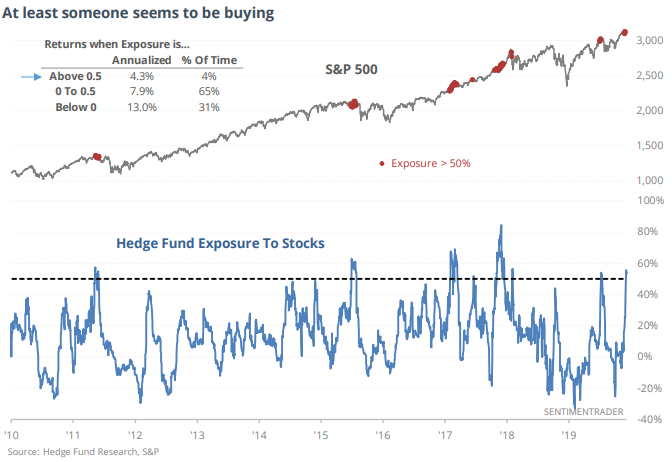
Such high levels of exposure usually led to weakness in stocks over the coming months. The exceptions were in 2017, when stocks surged upwards nonstop.
Sentiment
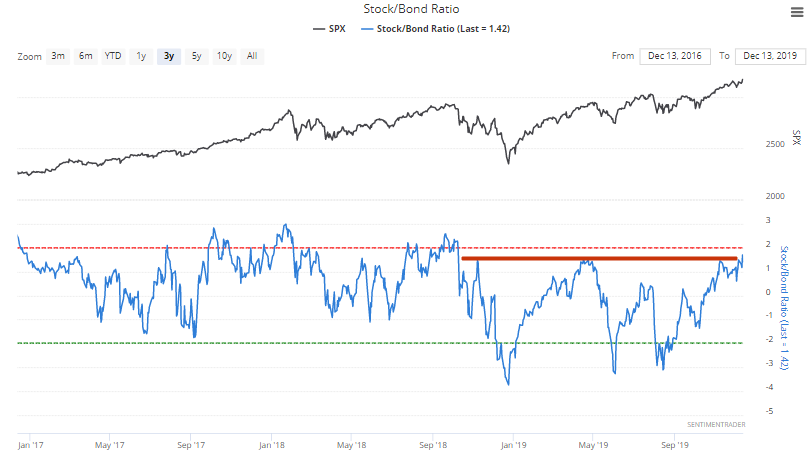
With stocks climbing higher, various sentiment indicators remain bearish factors for stocks over the next few months. One of the few sentiment indicators that hasn't been terribly high is the Stock/Bond ratio, which has remained somewhat subdued by bond prices rising along with stocks. But now that Treasury yields are no longer falling and stocks continue to rally, the Stock/Bond ratio is approaching excessive optimism territory:
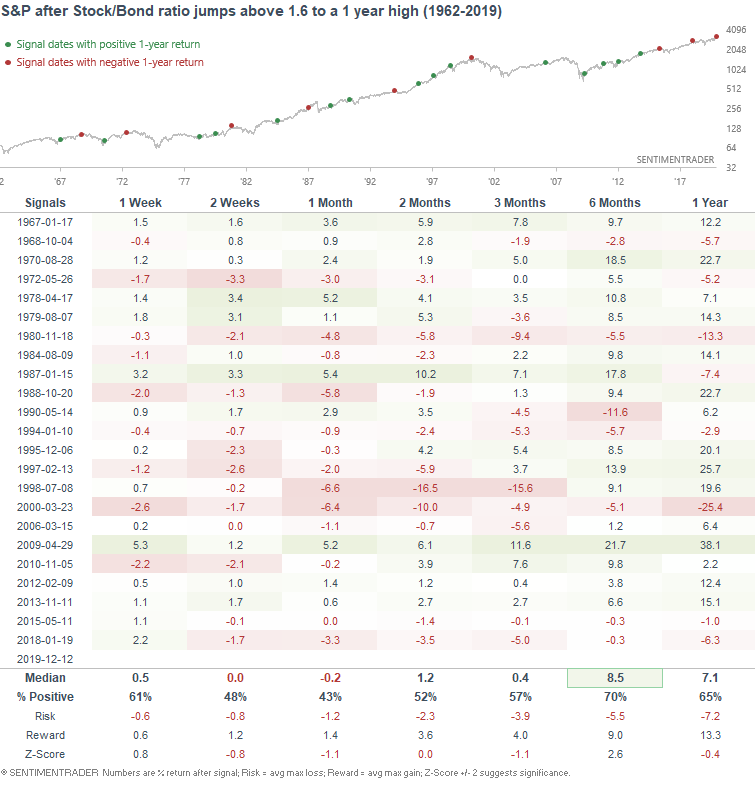
When the Stock/Bond ratio made a 1 year high (above 1.6), the S&P often struggled over the next month:
Overseas markets and momentum
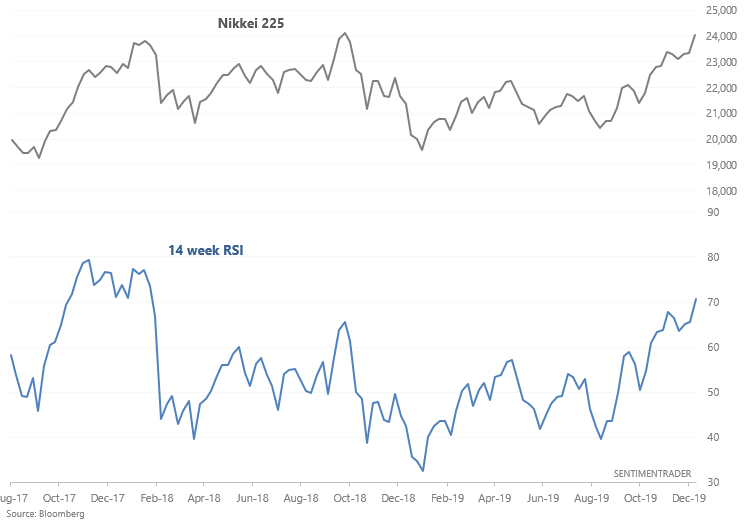
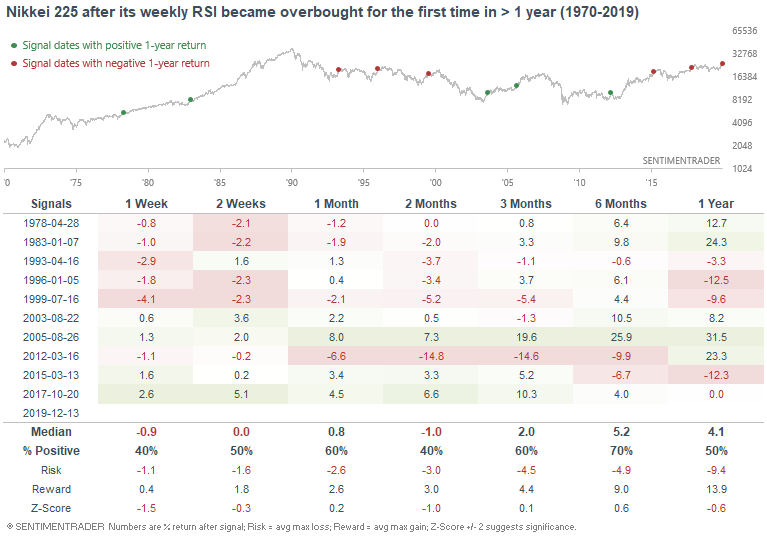
Many overseas markets have rallied significantly in recent months and are now becoming overextended. For example, the Nikkei's 14 week RSI exceeded 70 for the first time since January 2018:
When the Nikkei's rally become overbought for the first time in more than a year, its returns over the next 2 months were worse than random:
To recap
- Long term risk:reward doesn’t favor bulls.
- Fundamentals (6-12 months): still bullish because there is no significant U.S. macro deterioration.
- Technicals (3-6 months): neutral/bullish
- Technicals (1-2 months): bearish
Got any questions? Feel free to contact me at [email protected]
December 14, 2019: Fundamentals Overview Part 2
This is Part 2 of a weekly update on the U.S. stock market's long term fundamentals. Part 1 can be found here.
Fundamentals 1-3 years: market timing
I don't try to predict the future of the economy. Plenty of very smart people try, and when you add up the successes+failures, the results are usually no better than a 50/50 coin toss. That's why I focus instead on leading economic indicators. Look at what has already happened instead of predicting the future.
The economy drives corporate earnings, which drives the stock market in the long term. As a result, bull markets usually coincide with economic expansions, and big bear markets usually coincide with recessions.
Since the stock market tends to peak before recessions begin, we need to look at leading economic indicators, which also deteriorate before recessions begin. This doesn’t mean that the stock market’s exact top cannot occur before macro starts to peak. This happened in January 1973, when the stock market peaked a few months before macro started to deteriorate. However, the biggest part of bear markets always occur after macro has deteriorated significantly.
Here’s a brief summary of the leading and most important economic indicators I track, some of which I include in the Macro Index. The ones that are included in the Macro Index have an asterisk beside them**
Bullish factors right now
- Labor market**
- Housing**
- Financial conditions
- Heavy Truck Sales**
- Inflation-adjusted retail sales
Neutral/bearish factors right now
- Corporate profits
Bearish factors right now
- Yield curve**
- High yield spreads
- Manufacturing**
Bullish factors
Labor market
Labor market indicators do not show any significant deterioration right now.
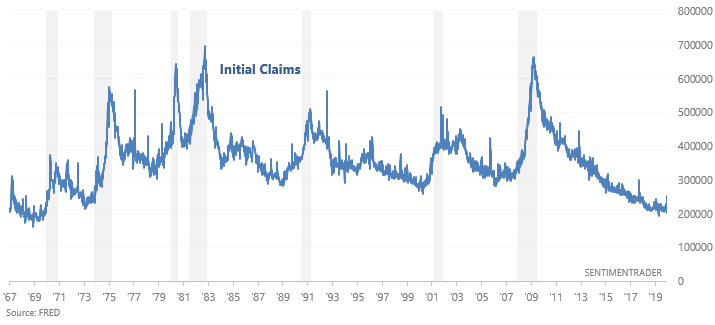
Initial Claims
Initial Jobless Claims measures the number of jobless claims filed by people who are seeking to receive jobless benefits. In other words, this measures the number of people who are recently unemployed. This economic indicator continues to trend sideways. In the past, Initial Claims trended higher before a recession began. This is still a positive point for macro, but watch out over the next few months in case Initial Claims trends upwards because Initial Claims is very low right now.
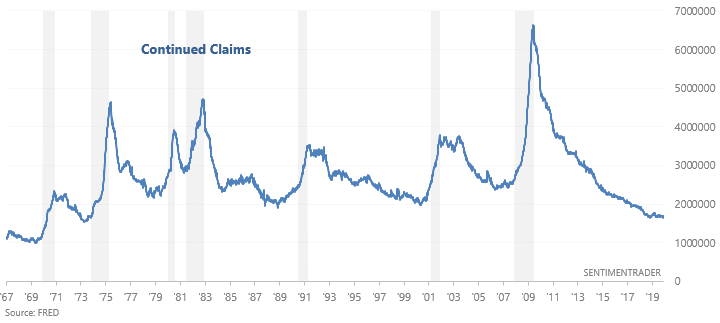
Continued Claims
Continued Jobless Claims measures the number of people who are still filing jobless claims (past the initial claim). This economic indicator continues to trend sideways. In the past, Continued Claims trended higher before a recession began. This is still a positive point for macro, but watch out over the next few months in case Continued Claims trends upwards because Continued Claims is very low right now.
Housing
Housing market indicators do not show significant deterioration right now.
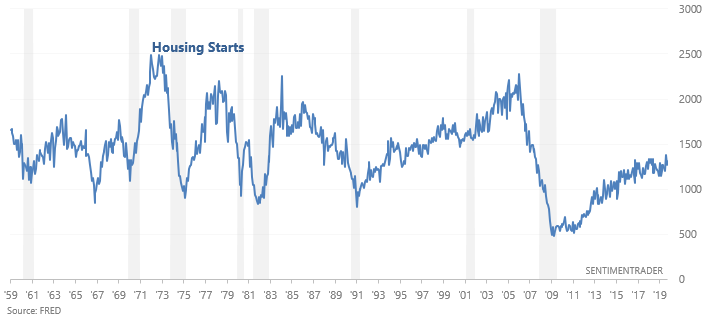
Housing Starts
Housing Starts measures the number of new homes that are starting to be built in the U.S., from the time of first excavation. This figure is trending sideways right now. In the past, Housing Starts trended downwards before recessions began. This is a positive for macro.
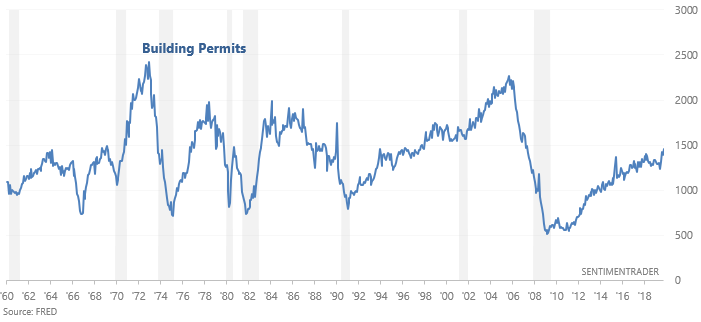
Building Permits
Building Permits are trending upwards right now. In the past, Building Permits trended downwards before recessions began. This is a positive for macro.
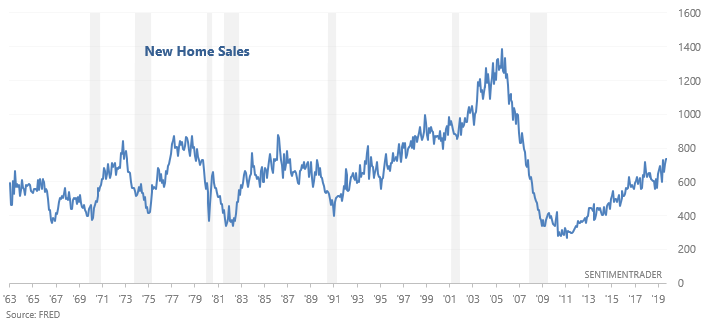
New Home Sales
New Home Sales are trending upwards right now. In the past, New Home Sales trended downwards before recessions began. This is a positive for macro.
Financial Conditions
Indicators related to financial conditions remain relatively loose. This is a positive for macro.
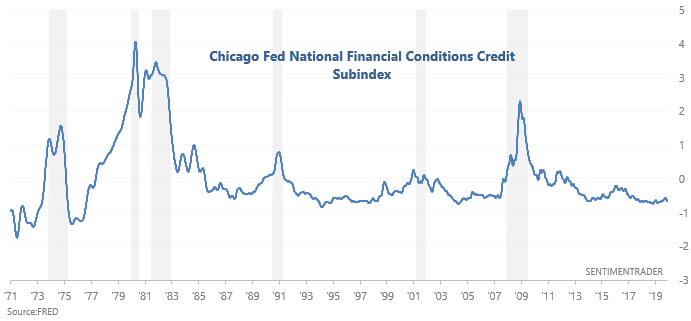
Chicago Fed Financial Conditions Credit Subindex
The Chicago Fed Financial Conditions Credit Subindex remains quite low. Looking at the bigger picture, the Credit Subindex is trending sideways/upwards right now. In a credit-driven economy, the Credit Subindex tends to trend solidly upwards (i.e. tighten) before a recession begins.
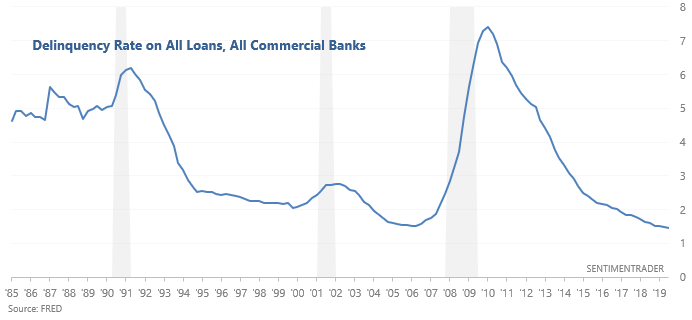
Loans
The Delinquency Rate on All Loans continues to trend downwards. In the past, the Delinquency Rate trended higher before a recession began. This is a positive for macro.
Banks’ lending standards
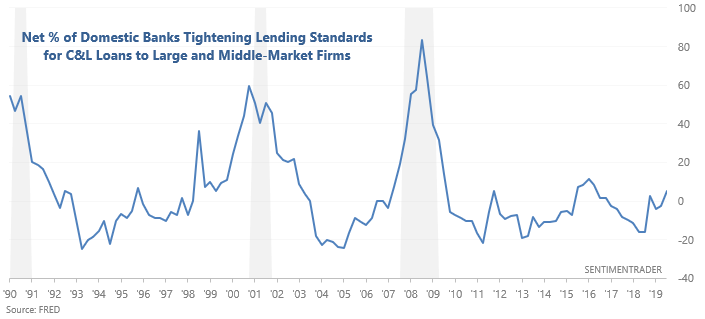
Banks are starting to tighten their lending standards right now. In the past, lending standards tightened for several quarters before a recession began, causing the Net Percentage of Banks Tightening Standards to trend higher. This was a positive for macro, but is now something that bulls should watch out for in case lending standards continue to tighten.
Inflation-adjusted retail sales
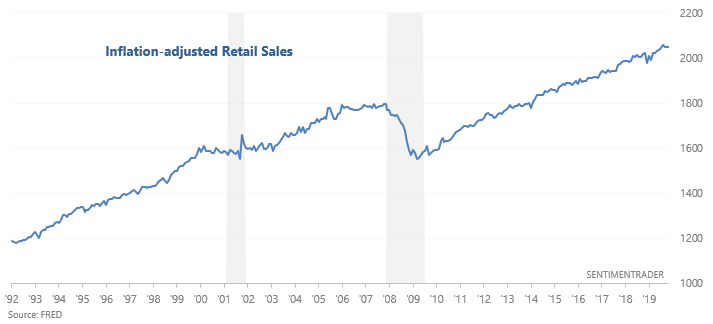
Inflation-adjusted Retail Sales continue to trend higher. In the past, inflation-adjusted Retail Sales trended sideways before recessions began. This is a positive for macro.
Neutral/bearish factors
Corporate Profits
Figures related to corporate profits suggest that the economic expansion is definitely late-cycle.
Unit Profits
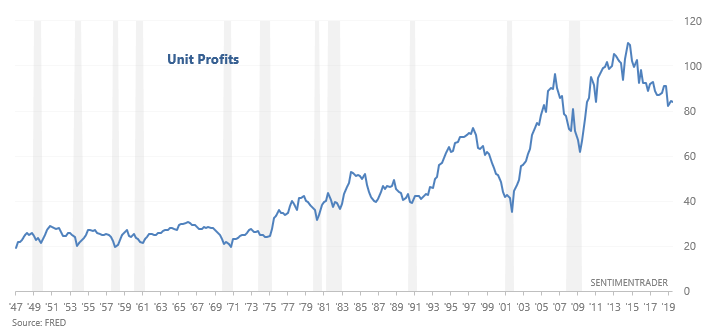
Unit Profits continue to trend downwards, which is typically what happens in the second half of an economic expansion cycle. However, this indicator is not a timing tool. Unit Profits can fall for years before a recession begins.
Corporate Profits
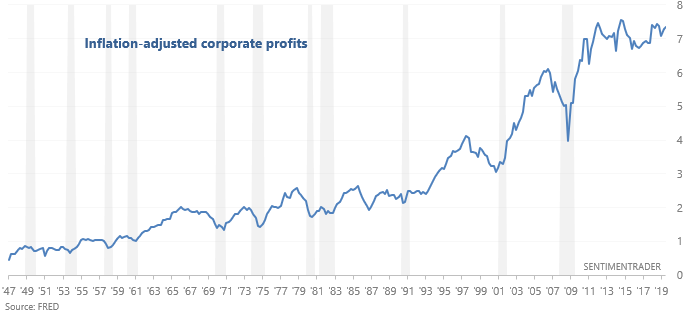
Inflation-adjusted corporate profits are trending sideways. In the past, inflation-adjusted corporate profits trended downwards for several quarters before recessions began. If corporate profits start to trend downwards, this will be a negative for macro in 2020.
Bearish factors
Yield Curve
Both the popular 10 year - 2 year and 10 year - 3 month sections of the yield curve were recently inverted, and are now trending higher. Here's the 10 year - 3 month yield curve, which historically has been a better market timing indicator than the 10 year - 2 year yield curve:
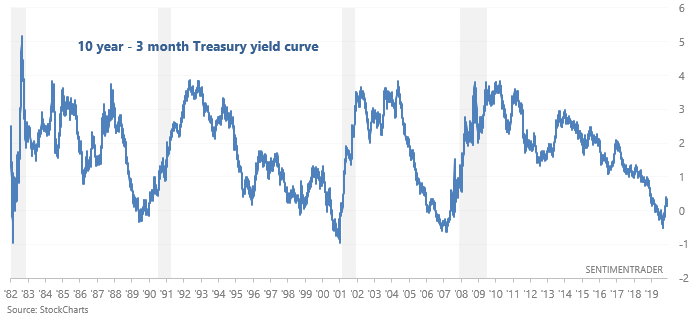
Overall, the yield curve is a bearish factor for macro right now because inversions & post-inversion steepenings tend to occur 1-2 years before recessions and bear markets begin. HOWEVER, the yield curve is merely one of many factors to consider, and it is not flawless.
High yield spreads
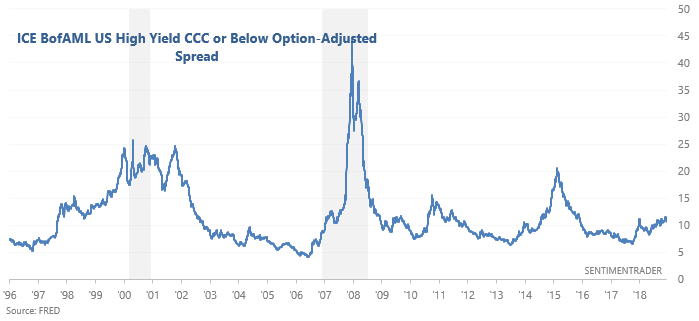
From September 2018 – present, high yield spreads on the lowest rated bonds have been trending higher while the stock market has made higher highs. This is a necessary but not sufficient condition for bear markets and recessions. In the past, high yield spreads on these bonds trended higher before bear markets and recessions began. This is because the average bond market participant is usually more aware of risk than the average stock market participant..
Manufacturing
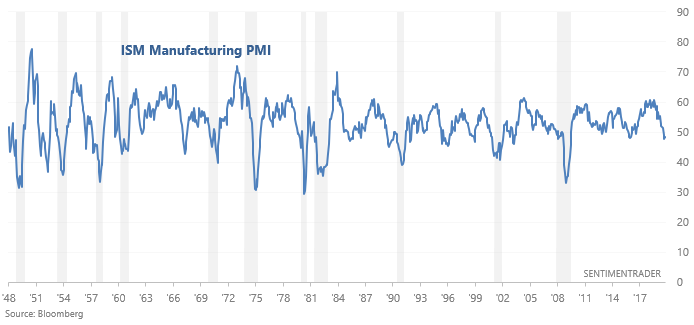
The manufacturing sector remains one of the weakest parts of the U.S. economy, and this is probably related to the trade war. For example, the ISM Manufacturing PMI is currently below 50, which signals contraction. This is a bearish factor for our Macro Index.
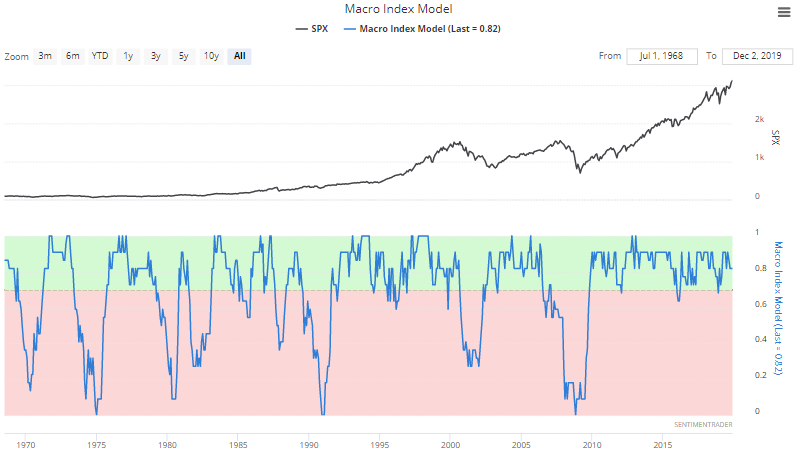
Macro Index
The Macro Index includes:
- New Home Sales
- Housing Starts
- Building Permits
- Initial Claims
- Continued Claims
- Heavy Truck Sales
- 10 year - 3 month Treasury yield curve
- S&P 500's 10 month average
- ISM Manufacturing PMI
- Margin Debt
- Inflation