Data &
Technology
Research
Reports
Report Solutions
Reports Library
Actionable
Strategies
Free
Resources
Simple Backtest Calculator
Simple Seasonality Calculator
The Kelly Criterion Calculator
Sentiment Geo Map
Public Research Reports
Free Webinar
Pricing
Company
About
Meet Our Team
In the News
Testimonials
Client Success Stories
Contact
Log inLoginSign up
< BACK TO ALL REPORTS

Market Breadth Composite Rank Update

Dean Christians
2021-08-04
The S&P 500 recorded a new all-time on Tuesday, 10/28/21. Let's review how the new high compares to history as measured by a market breadth composite.

The S&P 500 Index closed at a new all-time high on 8/3/21. Whenever an Index registers a new high, I always like to assess the market's internal condition to see if the troops are participating.

Let's review how the new all-time high compares to history as measured by a market breadth composite.

MARKET BREADTH COMPOSITE COMPONENTS

  • Percentage of issues above the 10-day moving average
  • Percentage of issues above the 50-day moving average
  • Percentage of issues above the 200-day moving average
  • Percentage Spread Between 21-Day Highs and Lows
  • Percentage Spread Between 63-Day Highs and Lows
  • Percentage Spread Between 252-Day Highs and Lows

The individual component values are summed and divided by six to arrive at a single composite value. Composite values can turn negative during corrections and bear markets as new lows overwhelm new highs in the spread calculation.

MARKET BREADTH COMPOSITE STUDY

I first identified every single all-time closing high in the S&P 500 Index since 1928. According to my calculation, there are 1,317 instances. I then ranked each breadth composite value on the day of the all-time closing high. Rankings range from 100 (strongest) to 0 (weakest). By ranking each all-time high, I can now make an apples-to-apple comparison throughout history. 

I conducted the same study for the S&P 1500 with data starting in 1963.

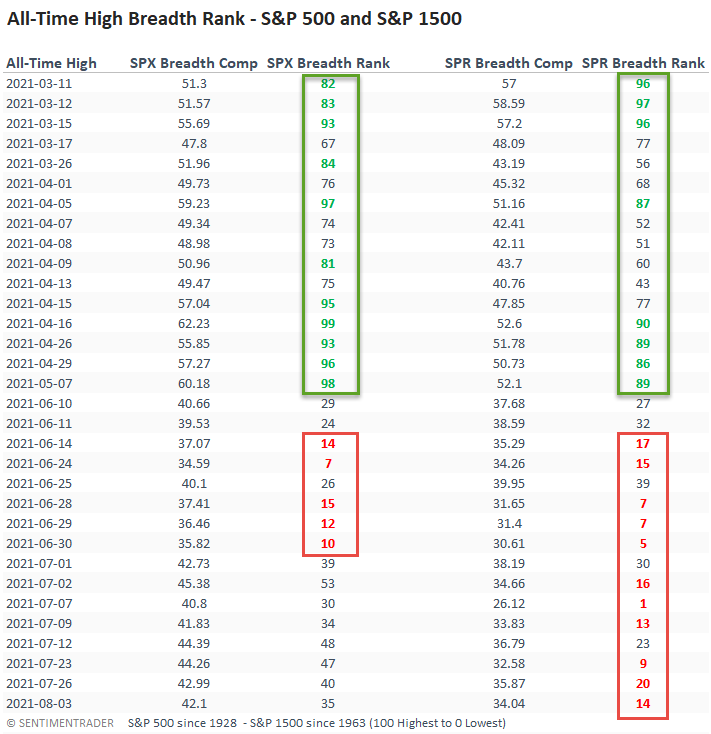
MARKET BREADTH COMPOSITE TABLE

Since my last update on 6/15/21, the S&P 500 has recorded 13 additional new all-time highs, with the most recent one occurring on Tuesday, 8/3/21. After a string of less than desirable rankings in June, market breadth for the S&P 500 has improved. However, it's not as strong as the data between March and May. Unfortunately, the same cannot be said for the S&P 1500 rankings, as participation remains weak. While short-duration components in the S&P 1500 composite have been soft for some time, we are now seeing some long-duration indicators retreat off the best levels. The percentage of members above the 200-day moving average is one example. I place a lot of weight on the number of 252-day lows in a bull market, and fortunately, they remain nonexistent.

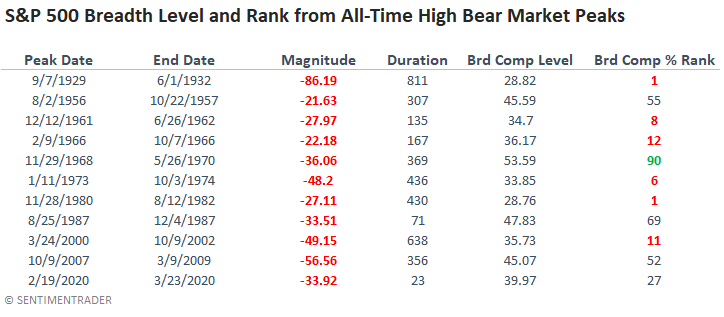
HISTORICAL PERSPECTIVE

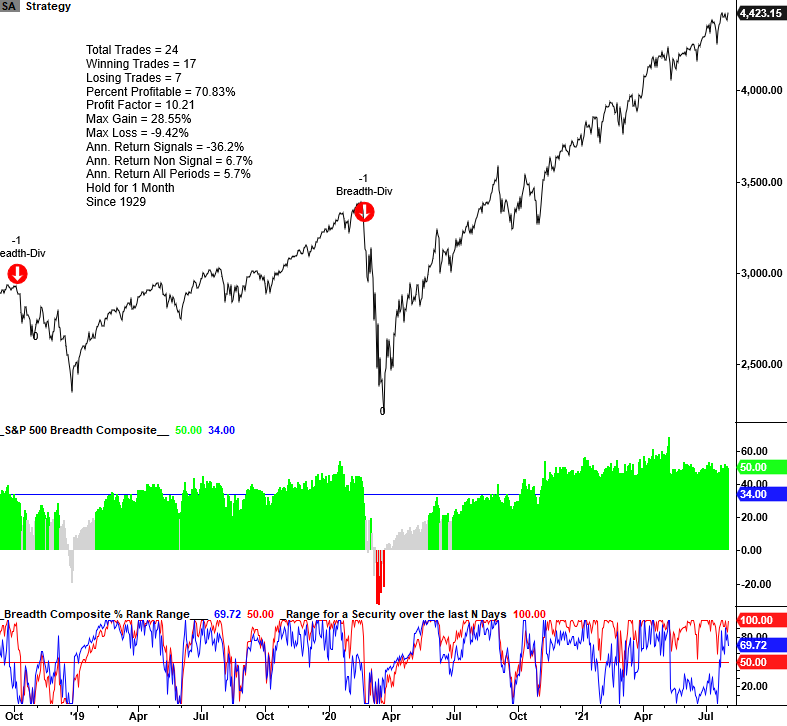
BREADTH COMPOSITE MODEL FOR DIVERGENCE SIGNALS

Suppose we switch our breadth composite to the long-duration model that we use to identify breadth divergences. In that case, we see a significantly different story. Breadth remains firm as the percentage of members above the 200-day average is healthy, and new 252-day lows are nonexistent.

If you were wondering, the blue line in the S&P 500 breadth composite indicator is the trigger level. For a signal to fire, the composite value must be below 34 for an alert.

For more detail on the breadth divergence model, please click here.


Long-term measures of market breadth continue to remain healthy. Therefore, we must respect the trend and stand firm with a constructive outlook on the market.

Sorry, you don't have access to this report

Upgrade your subscription plan to get access
Go to Dasboard
DATA &
TECHnologies
IndicatorEdge
‍
BackTestEdge
‍
Other Tools
‍
DataEdge API
RESEARCH
reports
Research Solution
‍
Reports Library
‍
actionable
Strategies
Trading Strategies
‍
Smart Stock Scanner
‍
FREE
RESOUrCES
Simple Backtest
Calculator
Simple Seasonality
Calculator
The Kelly Criterion
Calculator
Sentiment Geo Map
‍
Public Research Reports
‍
Free Webinar
COMPANY
‍
About
‍
Meet our Team
‍
In the News
‍
Testimonials
‍
Client Success Stories
Pricing
Bundle pricing
‍
Announcements
‍
FAQ
© 2024 Sundial Capital Research Inc. All rights reserved.
Setsail Marketing
TermsPrivacyAffiliate Program
Risk Disclosure: Futures and forex trading contains substantial risk and is not for every investor. An investor could potentially lose all or more than the initial investment. Risk capital is money that can be lost without jeopardizing ones’ financial security or life style. Only risk capital should be used for trading and only those with sufficient risk capital should consider trading. Past performance is not necessarily indicative of future results.

Hypothetical Performance Disclosure: Hypothetical performance results have many inherent limitations, some of which are described below. No representation is being made that any account will or is likely to achieve profits or losses similar to those shown; in fact, there are frequently sharp differences between hypothetical performance results and the actual results subsequently achieved by any particular trading program. One of the limitations of hypothetical performance results is that they are generally prepared with the benefit of hindsight. In addition, hypothetical trading does not involve financial risk, and no hypothetical trading record can completely account for the impact of financial risk of actual trading. for example, the ability to withstand losses or to adhere to a particular trading program in spite of trading losses are material points which can also adversely affect actual trading results. There are numerous other factors related to the markets in general or to the implementation of any specific trading program which cannot be fully accounted for in the preparation of hypothetical performance results and all which can adversely affect trading results.

Testimonial Disclosure: Testimonials appearing on this website may not be representative of other clients or customers and is not a guarantee of future performance or success.